Politics & "single-paper" polemics.
Many of the anti-AGW arguments are based on one paper, one dataset, etc. The bad science does get corrected in time. I wonder how many of the arguments quoated above on this thread were inspired by published, but severely flawed and comprehensively refuted, papers.
Here is a (polemic, but still interesting) list. It does what the anti-AGW people do - highlights mistakes and the people who consistently make them.
Whereas there are a lot of pro-AGW scientists only a few of whom make mistakes I suspect the mistake ratio is rather higher amongst the anti-AGW science community. Read and decide for yourselves...
http://www.realclimate.org/index.php/ar ... condition/
Global Warming Concensus Broken
I don't think you read the link. Sea ice has not decreased. It's the same as it was in 1979, and is at the highest level ever recorded. It was trending down for a while, then it trended right back to where it started, in flat contradiction to AGW claims it would continue to decline.I fail to see any obervations that can be drawn from this record except that sea-ice area is tending downwards.
http://www.dailytech.com/Article.aspx?newsid=13834
Sure, it was perfectly fair for them to cite the trend when it was going down. But it's even more fair for critics to point out "Hey, you were wrong about that decreasing sea ice thing" when it reverses and reaches record highs.If the IPCC report mentions the trend that is fair - if it mentions recent all-time mimimums within the trend that is hardly surprising.
See, this is a perfect example of why AGW is bad science. Science is supposed to look at theories critically, not put people on opposing sides of an environmental crusade.Whereas there are a lot of pro-AGW scientists only a few of whom make mistakes I suspect the mistake ratio is rather higher amongst the anti-AGW science community.
The fact is, many (if not most) AGW claims do not hold up well under serious scrutiny.
But Tom,Many of the anti-AGW arguments are based on one paper, one dataset, etc.
You asked for one foundation of AGW that if it failed - it would shoot down the theory. It has been provided. Now that is not enough.
OK. So how many "one papers" do you want?
And let me ask again. Even the head of the IPCC has said that the PDO may have contributed to the "warming" signal. We have known about the PDO for 10 years. Where are the papers trying to quantify "how much"? Why haven't those researches been funded?
Further - the foundation of AGW is a lot of "one papers". Why aren't a number of one papers questioning the theory enough to at least cast some doubt?
We see a lot of doubt re: Polywell. I know of no reputable scientist or engineer who says that Polywell is a sure thing. Art Carlson - definitely a sceptic - says it could work but low probability. I'm in the fan camp and will never say "sure thing" until there are watts going into the grid. Even if the physics is good the engineering is very tough.
Science is built on doubt. So is engineering. Once you have left doubt behind you are doing something other than science.
“I slept with faith and found a corpse in my arms on awakening; I drank and danced all night with doubt and found her a virgin in the morning.” - Aleister Crowley
Engineering is the art of making what you want from what you can get at a profit.
Simon -
You misunderstand me. I am on my mission to try to answer the (one) question you asked. I have started my LS. But it will take time - and I have my day job!
I was in parallel merely replying to some of the whole collection of earlier posts. I thought some people would find the process whereby a single rogue paper is taken up & trumpeted as the nail in the GW coffin interesting. It is true that equally annoying are the populist pro-GW accounts which use extreme weather events as "evidence" of GW. Evidence for trends is complex and arguing on outliers silly. But you should not blame scientists for political slogans politicians use.
As for - where are the figures? Simply answer would be to look at the many different GCMs referenced in IPCC4. They give a whole spectrum of different predictions, and different sensitivities for climate on CO2 concentration. The error bars for anything the IPCC concludes are pretty large!
Best wishes, Tom
TallDave -
I hope that you do think I am impolite - but you are egregiously wrong.
I posted links to several of the source datasets on arctic (and antarctic ice), and commentaries. These are the people who measure the stuff. My links were to graphs ging back 30 years or more from which trends can be computed. No-one can calculate a trend from one year. If you look at the data you will see:
(1) the annual variation is much larger than any trend, except over long time-scales.
(2) the noise in the signal is high, and trends are only discerible over time-scale of 10 years or more.
(3) The a-typical extreme melting last summer has been followed by a big freeze, but the trend remains downwards.
Your link (which did not work and I had to search) includes a graph which clearly indicated the downward trend:
http://images.dailytech.com/nimage/9972 ... y.gsia.jpg
The fact that at two specific points the anomaly is zero is not good statistics - you can find outliers in any stochastic sequence. Just look at the anomaly graph - you will see the two points chosen are both unusual, any sort of averaging reveals the trend?
It is not possible to assert a change in trend over just one year - but if you take the average of sea-ice over last 12 months (manual inspection - I have not done this precisely) it remains in line with the trend.
This sort of cavalier and improper use of numbers will discredit anyone who argues from it. Newspapers do it all the time...
Best wishes, Tom
Thank you - all those anti-GW posters on this thread. It is fun arguing a case against such opposition with no support. Since if I can't sustain my statements I will retract them I feel quite comfortable with this situation. And it means that I become better informed.
The LS I promised you will take a few days - I will try to do it over the w/e.
Best wishes, Tom
The LS I promised you will take a few days - I will try to do it over the w/e.
Best wishes, Tom
The GCM models do incorporate ocean currents and the PDO. I agree, there is some political spin on the IPCC conclusions. they don't want to make what is a conclusive scientific message sound weaker - you know how politicians choose words very carefully and weasel.Simon wrote: And let me ask again. Even the head of the IPCC has said that the PDO may have contributed to the "warming" signal. We have known about the PDO for 10 years. Where are the papers trying to quantify "how much"? Why haven't those researches been funded?
Further - the foundation of AGW is a lot of "one papers". Why aren't a number of one papers questioning the theory enough to at least cast some doubt?
A given GCM can be cross-validated against data including PDO mediated warming. It can be used to extract the all-important CO2 sensitivity. So the point is that all those GCMs that incorporate ocean currents as well as atmosphere, and model the PDO, will be doing this.
That is at least my understanding - I may be wrong but will leave further investigation of this till I have answered your first question.
There used to be much less agreement over GW, and many papers casting doubt. As models have improved (and data has got more reliable) the spread of opinion, though still wide, has got tighter. And now it is all (or at least 99%) pro-GW. That is what happens as predictions get more accurate.
they don't want to make what is a conclusive scientific message sound weaker - you know how politicians choose words very carefully and weasel.
But if telling the truth weakens the argument then the argument is not the truth.
The science is not as conclusive as claimed.
BTW the PDO is not included in GCMs. The article link that was posted up thread quoting the IPCC head makes that clear.
And why isn't it included? Good question. It is claimed to be unquatifiable re: duration. My guess is the real reason is that it might reduce the warming signal to zero. After all the last warm PDO (with minimal CO2 additions) produced a warming signal not too different (maybe slightly stronger) than the current PDO.
Why would believers and those dependent on warming funding want to open that can of worms? And a steady diet of worms? Not too appetizing for most.
==
So here is another shoot down of of AGW for you to look in to. Was the PDO of the 20s and 30s of the same scale as the most recent warm PDO we are exiting? If it was 75% as strong that would tend to reduce the CO2 contribution to the current estimated future warming from 1.5 to 4.5 C to .4 to 1.1 C. Hardly catastrophic. If it is even real.
Science is a bitch without doubt.
Engineering is the art of making what you want from what you can get at a profit.
Sigh. Has overall sea ice declined since 1979? Yes or no.I hope that you do think I am impolite - but you are egregiously wrong.
You linked some reports that are mostly several months old and thus conveniently don't mention the recent enormous growth in ice area. I linked a recent article,which does.I posted links to several of the source datasets on arctic (and antarctic ice), and commentaries.
So what? We're comparing troughs to troughs and peaks to peaks. That elinimates the annual variation issue. It's not like we're comparing 1979's trough to 2008's peak.(1) the annual variation is much larger than any trend, except over long time-scales.
OK, what's the trend from 1998-2008?(2) the noise in the signal is high, and trends are only discerible over time-scale of 10 years or more.
For Arctic sea ice, yes. For overall sea ice, the trend is flat. For Antarctic sea ice, the trend is actually up.(3) The a-typical extreme melting last summer has been followed by a big freeze, but the trend remains downwards.
It works fine for me.Your link (which did not work and I had to search
They aren't chosen arbitrarily. One of the points is right now, the other is when records started, and they're both highs, while AGW argues the later dates should be lows. We don't have any control over the flow of time, so you have to accept the endpoints we have, even if they're inconvenient to your thesis. You can draw a long trend line that goes down but tails up at the end, or a short one that goes way up from last year.The fact that at two specific points the anomaly is zero is not good statistics -
Oh, the irony in that statement.This sort of cavalier and improper use of numbers will discredit anyone who argues from it.
They aren't getting more accurate, just more complicated. No AGW model predicted temps would decline from 1998 - 2008, or that sea ice would increase.That is what happens as predictions get more accurate.
Last edited by TallDave on Wed Jan 14, 2009 7:55 pm, edited 2 times in total.
Predictions more accurate?
Hah. Ice has returned to 1979 levels. That was not predicted.
A 10 year flattening (possibly now dropping - we await the data) of the temp rise was not predicted.
The predictions may be converging. However, if they are based on incorrect assumptions they will be convergently wrong.
A cooling until 2015 (as suggested by the head of the IPCC) was not predicted. Even supposing there is only a flat trend until 2015 that would make 16 years of no warming with increasing CO2. I never noticed that prediction. Perhaps you have a link from 2007 or previous that could show such a prediction. I don't know if you recall but 2005, 2006, and 2007 were predicted to be warmer than ever years.
The whole AGW house of cards is falling. Human nature being what it is - some will never give up the faith.
http://english.pravda.ru/science/earth/ ... _ice_age-0
The earth is now on the brink of entering another Ice Age, according to a large and compelling body of evidence from within the field of climate science. Many sources of data which provide our knowledge base of long-term climate change indicate that the warm, twelve thousand year-long Holocene period will rather soon be coming to an end, and then the earth will return to Ice Age conditions for the next 100,000 years.
Ice cores, ocean sediment cores, the geologic record, and studies of ancient plant and animal populations all demonstrate a regular cyclic pattern of Ice Age glacial maximums which each last about 100,000 years, separated by intervening warm interglacials, each lasting about 12,000 years.
Most of the long-term climate data collected from various sources also shows a strong correlation with the three astronomical cycles which are together known as the Milankovich cycles. The three Milankovich cycles include the tilt of the earth, which varies over a 41,000 year period; the shape of the earth’s orbit, which changes over a period of 100,000 years; and the Precession of the Equinoxes, also known as the earth’s ‘wobble’, which gradually rotates the direction of the earth’s axis over a period of 26,000 years. According to the Milankovich theory of Ice Age causation, these three astronomical cycles, each of which effects the amount of solar radiation which reaches the earth, act together to produce the cycle of cold Ice Age maximums and warm interglacials.
The central piece of evidence that is cited in support of the AGW theory is the famous ‘hockey stick’ graph which was presented by Al Gore in his 2006 film “An Inconvenient Truth.” The ‘hockey stick’ graph shows an acute upward spike in global temperatures which began during the 1970s and continued through the winter of 2006/07. However, this warming trend was interrupted when the winter of 2007/8 delivered the deepest snow cover to the Northern Hemisphere since 1966 and the coldest temperatures since 2001. It now appears that the current Northern Hemisphere winter of 2008/09 will probably equal or surpass the winter of 2007/08 for both snow depth and cold temperatures.
The main flaw in the AGW theory is that its proponents focus on evidence from only the past one thousand years at most, while ignoring the evidence from the past million years -- evidence which is essential for a true understanding of climatology. The data from paleoclimatology provides us with an alternative and more credible explanation for the recent global temperature spike, based on the natural cycle of Ice Age maximums and interglacials.
The graph of the Vostok ice core data shows that the Ice Age maximums and the warm interglacials occur within a regular cyclic pattern, the graph-line of which is similar to the rhythm of a heartbeat on an electrocardiogram tracing. The Vostok data graph also shows that changes in global CO2 levels lag behind global temperature changes by about eight hundred years. What that indicates is that global temperatures precede or cause global CO2 changes, and not the reverse. In other words, increasing atmospheric CO2 is not causing global temperature to rise; instead the natural cyclic increase in global temperature is causing global CO2 to rise.
The AGW theory is based on data that is drawn from a ridiculously narrow span of time and it demonstrates a wanton disregard for the ‘big picture’ of long-term climate change. The data from paleoclimatology, including ice cores, sea sediments, geology, paleobotany and zoology, indicate that we are on the verge of entering another Ice Age, and the data also shows that severe and lasting climate change can occur within only a few years. While concern over the dubious threat of Anthropogenic Global Warming continues to distract the attention of people throughout the world, the very real threat of the approaching and inevitable Ice Age, which will render large parts of the Northern Hemisphere uninhabitable, is being foolishly ignored.
Engineering is the art of making what you want from what you can get at a profit.
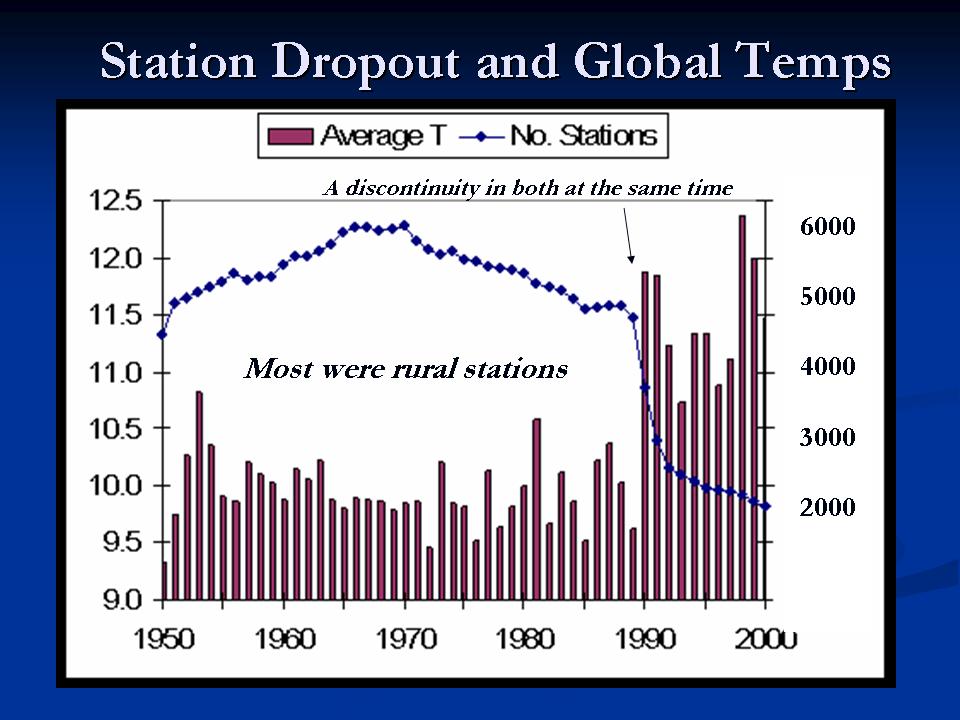
smoking gun of fraud
http://icecap.us/images/uploads/Stationdropout.jpg
ICECAP blog has a nice story documenting how 2/3 of ground stations, mostly rurally located, were kicked out or removed from the system in 1990, causing urban heat islands to impose a false warming signal.
ICECAP blog has a nice story documenting how 2/3 of ground stations, mostly rurally located, were kicked out or removed from the system in 1990, causing urban heat islands to impose a false warming signal.
Simon -
GCM stands for
Global
Cimate
Model
It does not make good predictions about chaos = weather < several years averaged.
It is true the same code can be used (with some modification) for weather forecasting but then due to chaos is accurate on a few days (if that).
GCMs are getting more able to model the medium-scale everns that shape climate like PDO etc. They now combine ocean circulation, atmoshere, & ice modelling. They are starting to have sioshere CO2 exchange modls but these are not very good - the ice sheet modelling is still partly deficient.
The models are getting better, will go on doing this. They can model quite a lot, but not everything.
Especially they can't model changes in solar forcing that are chaotic (as you have pointed). Other changes, due to earth orbit etc, can be modelled.
Re cooling - the pro-GCM scientists put their money where their models take them!
http://blogs.nature.com/climatefeedback ... e_cli.html
And here is a careful analysis of the recent Nature paper suggesting decadal factors will slow down warming over next 10 years. You will understand, if you read it carefully, that it in no way supports the skeptics.
http://climateprogress.org/2008/05/02/n ... d-warming/
What is there in this not to understand?
Best wishes, Tom
Last edited by tomclarke on Wed Jan 14, 2009 10:46 pm, edited 1 time in total.
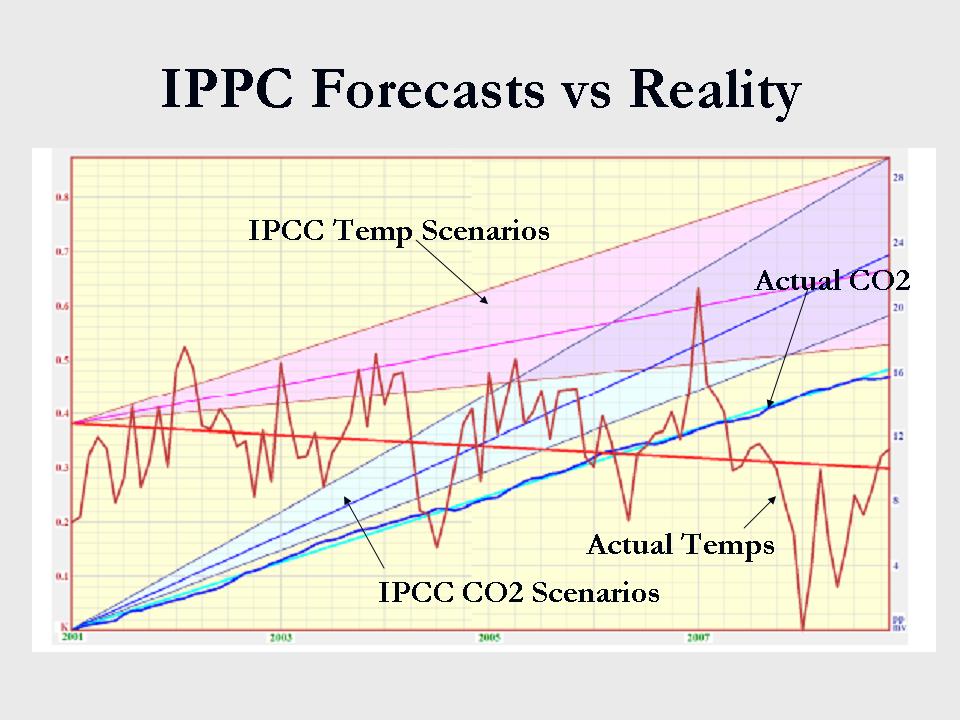
What is not understood is how such allegedly rigorous and accurage GCM applications (sorry, GCM apps are really weather apps being bastardized to make fake predictions about climate out in the fuzzy fuzzy future), is why the AGW cult can be so sure about them but then be so wrong.... watch this:tomclarke wrote:
What is there in this not to understand?
Best wishes, Tom
http://icecap.us/images/uploads/tc02vsIPCC.jpg
And more -
sea-ice levels - look at the graphs either that I posted or that were in Talldaves article (that I reposted). The trend is clear and high recent variability does not break it. You are good enough engineer not to misuse single data points I know.
Pravda -
Well - it has got more truthful since the old days. But I have never found Russian science particularly credible since days of Lysenko. And this particular flight of fancy certainly cannot be predicting return to ice-age except within 1000s of years.
Best wishes, Tom
who says GCMs are so accurate? It is only anti-GW people who conflate the three modes of prediction:Intlibber wrote: What is not understood is how such allegedly rigorous and accurage GCM applications (sorry, GCM apps are really weather apps being bastardized to make fake predictions about climate out in the fuzzy fuzzy future), is why the AGW cult can be so sure about them but then be so wrong.... watch this:
weather (before chaos sets in, but limited by uncertain initial data)
chaotic (no sensible prediction possible)
long-term averages - what the GCMs are quite good at
Timescale for chaos is a year or so atmosphere, maybe 10-20 years ocean currents.
The GCMs are also not great at long-term averages because the forcing factors are not all understood. A once in 10K years sunspot minimum would indeed make a big difference to global temperature and not fault of GCMs that they do not yet predict sunspot activity.
Ocean currents like PDO provide chaotic decadal noise (but average out over much longer periods). Models are only starting to include & predict these. I doubt they will be much good at prediction on decadal scales because chaos will rule.
None of which invalidates the model's prediction of overall long-term (50 years time constant) rise due to CO2.
best wishes, Tom