Page 1 of 1

Coincidence

Posted: Mon Aug 04, 2014 5:19 am
by MSimon

Re: Coincidence

Posted: Mon Aug 04, 2014 10:34 am
by tomclarke
LOL. This is a good one!

I'm happy to send some time on the raw temperature adjustment issue.

(1) plotting adjustment vs CO2 is of course the same as plotting adjustment vs time. CO2 is a close proxy for date. And this makes what is going on much clearer and makes it easier to see the mechanisms. Oh - but denialists don't want that do they? they already know the mechanism - climate scientists fiddling the figures - and more detail is not warranted! But I like detail. In fact I reply to this stuff with pleasure because I like solving mysteries - this is a good one.

When you translate back from CO2 concentration to the more normally used date timescale you see that Steve Goddard has weirdly stopped plotting around 1958. Why would that be? Oh - perhaps because before about 1950 the adjustments were negatively correlated with date whereas after 1958 they were positively correlated? And now we understand the use of CO2 concentration. the ML CO2 trend data, which is high quality, starts in 1958 which gives Steve a really good excuse to look only at the part of the adjustments he wants to!

That does not seem to be a good reason to me, so let us look at the whole thing - un-tampered. And lets look at adjustment versus date since you have to be wearing tin-foil cap in bed at night to think that better correlation with CO2 than with date on this is anything other than an artifact - if true! I mean - even if the warmista climate scientists are e-mailing each other very day to coordinate a Big Lie - why would they make their Big Lie adjustments correlate with CO2? On the other hand there are possible artifacts that would correlate with CO2 since the exact CO2 data from Mauna Loa has a saw-tooth annual chnage superimposed on the trend - that could quite easily alias with the time at which points are plotted etc...

OK - so if you think the previous para is over-complex just ignore it. We will look at adjustment versus date and over the entire range of adjustments because that gives best understanding into what is going on.

Anyone interested in deciphering this denialist-wet-dream graph should first look at a better documented and more transparent - because the code used to generate it is openly available and criticised - attempt top do the same thing.
http://moyhu.blogspot.co.uk/2014/05/non ... ments.html

This page has as you can see the USHNC temperature adjustments and the tmax/tmin/tavg breakdown of same - which gives more insight into what is going on.

There is a definite correlation with date - and hence CO2.
Image

Before 1950 the trend is negative with date, after 1950 the trend is larger and positive with date. Why is there this trend? Well, one reason is because the most significant of the adjustments - TOBS - goes consistently hotter with time as a greater number of stations move observations times from "old style" to "new style". That may not be the only issue.

[I get the feeling that most here are not really interested in working out for themselves the details of what are the adjustments and do they make sense. They'd rather just see that the adjustments have a warming trend that is consistent with ideas of warmist conspiracy to fiddle figures and leave it at that. Those same people would view the Berkeley earth project - set up and funded by climate skeptics to challenge the consensus on exactly this issue - as a part of the warmist conspiracy - since the results - very similar to the consensus - don't go the way they want. But I'm happy to look at these things. After all - you never know I might discover some warmist conspiracy - though since there are thousand of others who have done the same validation before me that seems a bit unlikely.]

So there are two issues here. One is why the adjustments look as they do - with a continuous warming trend from 1950, a continuous cooling trend before 1950, and a bit of noise. The other is why Steve Goddard's claimed plot of same with CO2 has such high R^2.

The independent and open (code available for others to run - all data precisely specified) comparisons look the same as the official comparison published by USHCN. They do show an adjustment warming trend from 1950-2000. The last 15 years adjustment trend have been flat.

I'm naturally suspicious and curious. Why is there this change in trend? And why does Steve's massaged graph not show it?

I'm going to do some more research and it may take me a while before I get to the bottom of this.

Tom

Re: Coincidence

Posted: Mon Aug 04, 2014 10:49 am
by MSimon
Tom,

You are confusing adjustment with temperature. Why would adjustments increase monotonically? Shouldn't the actual temperature be sufficient to accomplish that? Given CO2 rising and all?

And if the temperatures need correction (adjustment) why are the corrections monotonically in tune with CO2?

You need to pay more attention.

This is a comparison between raw data and reported (adjusted) data.

You are embarrassing yourself with your faith. Which is fortunately for you unshakable. But I suppose there is nothing CO2 can't do. The omnipotent gas. Given that it is the basis of life on Earth you faith is not entirely unwarranted.

Re: Coincidence

Posted: Mon Aug 04, 2014 10:56 am
by tomclarke
Those interested might want to see this post on Judith Curry's blog, which goes into a lot of detail (with graphs) about how adjustments are made and why they are needed.
http://judithcurry.com/2014/07/07/under ... ture-data/

Re: Coincidence

Posted: Mon Aug 04, 2014 11:17 am
by tomclarke
MSimon wrote:Tom,

You are confusing adjustment with temperature.
No - I'm not. All these graphs (both the denialist wet dream and the others) are plotting the temperature change due to temperature data adjustment against time.
Why would adjustments increase monotonically? Shouldn't the actual temperature be sufficient to accomplish that? Given CO2 rising and all?
It may surprise you but unlike deniers, who look for evidence to back their prejudice scientists just try to get things right. The post on Judith's blog I linked above does a good job of explaining why adjustments are needed: it is because of changes in the way data is collected in weather stations that generate step jumps in temperature readings from them. There are thousands of stations and a change like moving from mid-day to morning reading time, or from LiG to MMTS measuring instruments, introduce systematic biasses. Because these changes occur randomly and progressively (e.g. when stations need to be replaced, or when the person operating them changes) the effect of compensating for all these step changes is a progressive adjustment. For its magnitude, and how the different adjustments all look, see the link.
http://judithcurry.com/2014/07/07/under ... ture-data/
And if the temperatures need correction (adjustment) why are the corrections monotonically in tune with CO2?
CO2 is monotonic (nearly linear) with time.
The corrections are (mostly) monotonic (roughly linear) with time.
Steve's graph (denialist wet dream) has been massaged to make the relationship look better than it is:
(1) by omitting anything before 1958 - which does not fit
(2) in other ways - I'm not sure - but you will see that the raw data from which it should come has a completely different trend after about 2000. I've posted a page of discussion with transparent code doing the graph plotting which bears out my (less denialist wet dream) story. Steve's exact code and data used remains clouded in secrecy so till we get this and his tricks are decoded I can't say how he got that graph.
You need to pay more attention.
We have different ideas about pay attension. You mean - read in detail the posts that are in tune with your prejudices. I mean, read in detail those posts, comments on them, source data, posts contradicting them, posts replying to the psits that contradict the originals, etc. When you have done that you have a pretty good idea who is using tricks, who is ignoring part of teh picture, etc. It is fun - I'd recommend it.
This is a comparison between raw data and reported (adjusted) data.
Both the raw data, the adjusted data, and the adjustment (in graphical form, versus time) are reported.
there are at least two different sets of people doing these adjustments. One is BEST - which was funded by climate skeptics and has as its mission to generate a temperature record independent of the standard one and detect errors, fiddles, etc. it uses different adjustment algorithms but come sup with very similar results.

Why do you think that is?

You are embarrassing yourself with your faith. Which is fortunately for you unshakable. But I suppose there is nothing CO2 can't do. The omnipotent gas. Given that it is the basis of life on Earth you faith is not entirely unwarranted.
My view of these threads is that:
(1) I'm having fun
(2) I'm embarrassing you by stating the scientific facts behind all the denialist propaganda you post and showing you how false 95% of it is.

you will notice this is not true of all the criticism of the consensus position on CO2. There is room for arguments that systematic unconscious and group bias error means that ECS should be lower than the IPCC reports reckon is a best bet. I don't think they are very strong - but then I also don't think that with different independent strands of evidence contradictory the "average" value of 3c/doubling is very strong. ECS is just not well understood.

BUT you will need to get of your arse and do some decent thinking for yourself, rather than accepting uncritically ideas and blogs that sound good, before you are in a position to argue rationally for lower ECS, And when you've educated yourself that much you will find it really hard to argue for ECS below 1.5C/doubling.

At the moment I'm happy to go on exposing every single denialist bit of propaganda posted here. And I'll discuss, but not destroy, every real informed argument for lower or higher ECS too. So far there have not been too many of them.

PS - your oft-repeated view that I somehow am fixated on CO2 is rubbish. Many things influence the climate in the 20C and at other times. The consensus view is that the effect of CO2 is to give somewhere between 150% and 50% of the 20C global warming. That allows for other stuff to alter temperature the same amount + or half as much - as CO2 does. So it is hardly all powerful, just likely though not definitely dominant during an unusual time when we have very suddenly changed its concentration by a factor of 2. That sudden change is unique in geological history - as far as we know - so it is not surprising it has some effect - but we are still not talking about a very large effect by geological standards. Maybe 1.5C - 4.5C. Personally, for many reasons to complex to state now, I'd make that more like 1.5C - 4C likely range. But I might be wrong. The consensus might be wrong. Maybe it is actually 6C, or 1C. But all we can do is collect evidence and reckon what is likely. There is now a lot of evidence.

Re: Coincidence

Posted: Mon Aug 04, 2014 1:29 pm
by MSimon
So the way data is collected changes every year? So it needs to be adjusted (up) every year? How convenient. And don't you find the R^2 value (showing the match between CO2 and adjustments) a little too pat?

Probably not.

BTW the algorithm used can not possibly make a correct adjustment. Temperatures measured in one spot (a backyard) can be all over the place. Wind variability will not be the same. Shielding by hills will not be the same. In fact there are so many confounding variables the whole effort is a sham.

The first thing you would have to prove is that there is a constant difference between the two stations. That is easiest. The next best is some fixed very low order algorithm. After that it is just making up stuff. A station on top of a hill is going to have different variations from one in a valley. One next to a body of water is going to be different from a station surrounded by land.

Ever looked at a wind map? The wind doesn't blow in straight lines. It curves with velocity varying along the curve. Inside the curve will be different from outside. Rain in one spot will not mirror rain in another. Cloud cover will be different.

What we have here is computerized gun decking. But that is fine. Because it almost exactly matches CO2 linearly.

BTW Chief IO is a math guy. Make you arguments over there. I think you will get picked apart. I'm just a measurement guy. I design instruments.

Now this exercise might have some validity if all the confounding variables were accounted for. That is the way engineers do it. But climate science is different.

Another way to look at this is that the CO2 signal is an artifact of the adjustment method. And other than sophistry you have no way to prove you have a real signal.

http://stevengoddard.wordpress.com/data ... ushcngiss/
http://wattsupwiththat.com/2014/06/28/t ... -data-set/
Sometimes, you can believe you are entirely right while simultaneously believing that you’ve done due diligence. That’s what confirmation bias is all about. In this case, a whole bunch of people, including me, got a severe case of it.

I’m talking about the claim made by Steve Goddard that 40% of the USHCN data is “fabricated”. which I and few other people thought was clearly wrong.

Dr. Judith Curry and I have been conversing a lot via email over the past two days, and she has written an illuminating essay that explores the issue raised by Goddard and the sociology going on. See her essay:

http://judithcurry.com/2014/06/28/skept ... ard-right/

Steve Goddard aka Tony Heller deserves the credit for the initial finding, Paul Homewood deserves the credit for taking the finding and establishing it in a more comprehensible way that opened closed eyes, including mine, in this post entitled Massive Temperature Adjustments At Luling, Texas. Along with that is his latest followup, showing the problem isn’t limited to Texas, but also in Kansas. And there’s more about this below.
Links at the WUWT link.

Re: Coincidence

Posted: Mon Aug 04, 2014 1:54 pm
by tomclarke
MSimon wrote:So the way data is collected changes every year? So it needs to be adjusted (up) every year? How convenient. And don't you find the R^2 value (showing the match between CO2 and adjustments) a little too pat?
Sigh. Details matter. Have you looked at the details of how and why the adjustments are made? Because what you've written above leads me to think you do not yet understand what they are.
Probably not.

BTW the algorithm used can not possibly make a correct adjustment. Temperatures measured in one spot (a backyard) can be all over the place. Wind variability will not be the same. Shielding by hills will not be the same. In fact there are so many confounding variables the whole effort is a sham.
There are a whole load of adjustment algorithm, each one of which has its own graph of adjustment temp vs date. Now overall these adjustments make temp go upwards with date, but some adjustments lead to downward trends. We could look ta this in more detail, but you'd need enough interest (and humility) to look at the details in which you might find things that would alter your views. Or not. I don't knoww. But either way you are better with rational understanding of the details when there are possible inconsistencies.
The first thing you would have to prove is that there is a constant difference between the two stations. That is easiest. The next best is some fixed very low order algorithm. After that it is just making up stuff. A station on top of a hill is going to have different variations from one in a valley. One next to a body of water is going to be different from a station surrounded by land.
I'm really not sure which adjustment algorithm you are now talking about. But the argument is wrong for all of them. Tell me which adjustment you think conforms to this and I'll go through it and show you how it works and why this summary is incorrect.
Ever looked at a wind map? The wind doesn't blow in straight lines. It curves with velocity varying along the curve. Inside the curve will be different from outside. Rain in one spot will not mirror rain in another. Cloud cover will be different.
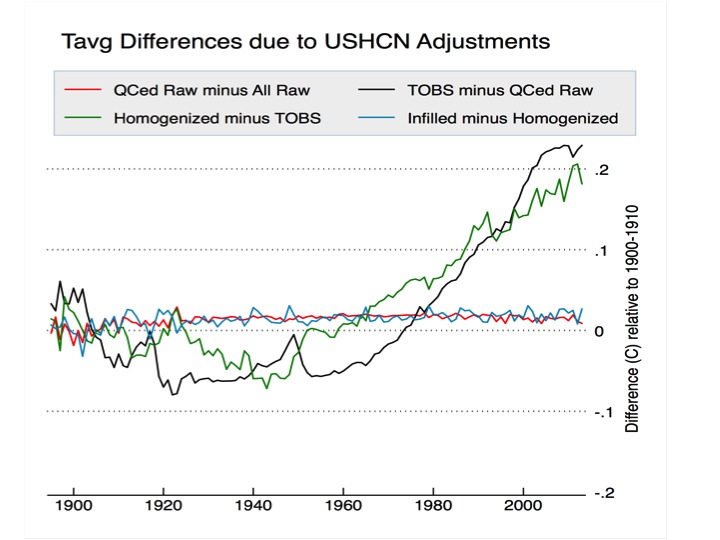
I get the feeling that the algorithm you are now talking about is what does infilling? But that does not introduce much of a temperature trend. Nor does homogenisation. The only big trend comes from TOBS, which is nothing to do with what you are saying here.
What we have here is computerized gun decking. But that is fine. Because it almost exactly matches CO2 linearly.

BTW Chief IO is a math guy. Make you arguments over there. I think you will get picked apart. I'm just a measurement guy. I design instruments.

Now this exercise might have some validity if all the confounding variables were accounted for. That is the way engineers do it. But climate science is different.
I think you are rational enough to worry when you are misunderstanding something. This post tells me that you are thinking the temperature trend from adjustments (which is quite striking) comes from homogenisation/infilling of data. It does not. It comes mostly from another adjustment.
Another way to look at this is that the CO2 signal is an artifact of the adjustment method. And other than sophistry you have no way to prove you have a real signal.
That is the way Steve wants you to look at it, yes. But don't you think you will be better able to judge if you look yourself at what are the various adjustments and how they are made instead of just making assumptions? My link above is quite readable, is posted on Judith Curry's site (and she is hardly a "warmist") and gives lots of facts about the adjustments and how each one contributes and how its made.
http://stevengoddard.wordpress.com/data ... ushcngiss/
http://wattsupwiththat.com/2014/06/28/t ... -data-set/
Sometimes, you can believe you are entirely right while simultaneously believing that you’ve done due diligence. That’s what confirmation bias is all about. In this case, a whole bunch of people, including me, got a severe case of it.

I’m talking about the claim made by Steve Goddard that 40% of the USHCN data is “fabricated”. which I and few other people thought was clearly wrong.

Dr. Judith Curry and I have been conversing a lot via email over the past two days, and she has written an illuminating essay that explores the issue raised by Goddard and the sociology going on. See her essay:

http://judithcurry.com/2014/06/28/skept ... ard-right/

Steve Goddard aka Tony Heller deserves the credit for the initial finding, Paul Homewood deserves the credit for taking the finding and establishing it in a more comprehensible way that opened closed eyes, including mine, in this post entitled Massive Temperature Adjustments At Luling, Texas. Along with that is his latest followup, showing the problem isn’t limited to Texas, but also in Kansas. And there’s more about this below.
Links at the WUWT link.
OK - this will take a while to disentangle, because you are doing what those who have prejudices often do - changing the subject as soon as we get close to showing you something new in one area. From your point of view all this different stuff is consistent and reinforces your world view. I knock down one bit and without worrying you can think - its too much trouble arguing - I know he's wrong because of all the other bits - and move to another bit.

You can probably see that this approach allows you to have a consistently wrong worldview which is impregnable - because there will always be "new bits" and it takes time and effort from both you and whomever is checking (in this case me) to look at the details of each bit and see whether it is right or wrong.

However, if you took the time to follow for yourself my points, research the contrary view, try to knock it down, compare, discuss, on just one point you would emerge with a better understanding. We could then move to the next point. If - as I suspect - you go through 5 or more such points with your view of their correctness shattered each time that might give you cause to think even though you would have in mind 100 or so other points each of which seem to you to be equally powerful. It would then come down to your intellectual honesty - would you, having found what seemed like strong evidence prove to be not that in a couple of cases - begin to doubt all the rest of what seems equally strong evidence?

Can I ask -

Are you still claiming that CO2 pre-industrial was high compared with now? That there is even a 1% chance of that?

Are you still claiming that CO2 is not a GHG? That there is even a 1% chance of that?

I've knocked those two points on the head inasfar as they have been argued. But I'm happy to take criticism of my critique and go into either in more details. They are both points that can be definitively answered by facts, where the denialist myths are provably wrong and the misconceptions can be explained.

Re: Coincidence

Posted: Mon Aug 04, 2014 4:03 pm
by tomclarke
So - while Simon is still working out what to make of my reply to his comments above I thought I'd give a bit of context.

Image

This graph shows the effect of homogenisation and [TOBS[/b] adjustments to land station temperature record. You can see that the homogenisation adjustments - which have been a hot topic for web deniers - really have no trend (as you'd expect) and not much difference to the result.

The "40% fabricated data" does not do very much. I can if you like on another thread - if somone starts one I will - show why infilling data is absolutely necessary unless you redefine data so that missing temperature records have no effect on averages. That is all infilling does.

The temperature trend that everyone notes is caused by the TOBS adjustment - which no-one here seems to understand.

That is probably because the mostly read climate denialist web sites. These do not want to look into how TOBS adjustment is made, and why, because it is much more effective propaganda not to look in detail at the adjustments and assume they are fiddling the figures.

So, since polywell is not a denialist website - at least not as long as I'm posting here - let us look at TOBS and how it works. The key graph of data is this one.
Image

If you want an explanation of TOBS try here:
http://judithcurry.com/2014/07/07/under ... ture-data/

more later.