bcglorf wrote:I still insist the biggest problem with the 'unprecedented' warming argument and defense of it is the temperature record itself... The strongest argument brought out is tree ring data, but tree ring data does NOT show anything abnormal in the last 100 years.
To expand upon what Tom has said (that you can't take one single study and use it against all others), I think a fair place to look is the
report the National Academy of Sciences put together at the request of Republican Sherwood Boehlert. They considered hundreds upon hundreds of studys concerning not only tree rings, but also ice isotopes, glacier size, and boreholes. They present charts that do show marked warming over the past century from not only tree rings, but a wide array of sources.
Concerning tree rings, take a look at
Chapter 4
In your post you refer to 2 studies on tree rings. Here are the studies taken into account by the NAS's report (on tree rings alone):
* Grissino-Mayer and Fritts 1997
* Kullman 1998
* Körner 1999
* Grace 1988
* Junttila 1986
* Loveys et al. 2002
* MacDonald et al. 1998
* Esper and Schweingruber 2004
* Paulsen et al. 2000
* Lloyd and Graumlich 1997
* Kjällgren and Kullman 2002
* Daniels and Veblen 2003
* Biondi et al. 2005
* Deslauriers et al. 2003
* Rossi et al. 2006
* Mikola 1962
* Kalela-Brundin 1999
* Helama et al. 2002
* Fritts et al. 1991
* Hunt Jr. et al. 1991
* Scuderi et al. 1993
* Berninger et al. 2004
* Misson 2004
* LaMarche 1974
* Vaganov et al. 2006
* Jones et al. 1998
* Hughes 2002
* Cronin 1999
* Schweingruber 1988
* Fritts and Swetnam 1989
* Biondi et al. 1994
* Kienast and Schweingruber 1986
* Villalba et al. 1994
* Buckley et al. 1997
* Tardif et al. 2003
* Piovesan et al. 2005
* Bunn et al. 2005
* Tardif and Bergeron 1997
* Bräker 2002
* Wigley et al. 1984
* Grissino-Mayer 2003
* Baillie and Pilcher 1973
* Wigley et al. 1987
* Yamaguchi 1991
* Stokes and Smiley 1996
* Holmes 1983
* Grissino-Mayer 1997
* LaMarche and Harlan 1973
* Friedrich et al. 2004
* Eckstein et al. 1984
* Webb 1983
* Conkey 1986
* Briffa et al. 2002
* Wang et al. 2002
* Fritts 1976
* Cook and Kairiukstis 1990
* Biondi and Swetnam 1987
* Biondi and Waikul 2004
* Cook et al. 1995
* Grudd et al. 2002
* Briffa et al. 1992
* Esper et al. 2003
* Bunn et al. 2004
* Esper et al. 2002
* Gunnarson and Linderholm 2002
* Naurzbaev et al. 2002
* Trotter et al. 2002
* Hughes et al. 1984
* Fritts 1991
* D’Arrigo et al. 2006
* Xoplaki et al. 2005
* Pollack and Smerdon 2004
* Oerlemans 2005
* Camardi 1999
* Jacoby and D’Arrigo 1995
* Briffa et al. 1998
* Barber et al. 2000
* Lloyd and Fastie 2002
* Wilmking and Juday 2005
* Vaganov et al. 1999
* Briffa et al. 2004
* Hoyt 2006
* D’Arrigo et al. 2001
* Büntgen et al. 2005
* Cook et al. 2004
* Bugmann 1996
* Naurzbaev et al. 2004
* Luckman and Wilson 2005
* Helle and Schleser 2004
* Biondi et al. 1999
* Anchukaitis et al. 2006
* LaMarche et al. 1984
* Graybill and Idso 1993
* Knapp et al. 2001
* Bunn et al. 2003
* Tang et al. 1999
* Nicolussi et al. 1995
* Hamilton et al. 2002
* Hättenschwiler et al. 2002
* Graumlich 1991
* Kienast and Luxmoore 1988
* Körner 2003
* Vitousek et al. 1997
* Kostiainen et al. 2004
Based on these studies and the studies on the other forms of evidence on temperature, they conclude:
National Academy of Sciences wrote:
After considering all of the available evidence, including the curves shown in Figure S-1, the committee has reached the following conclusions
...
Large-scale surface temperature reconstructions yield a generally consistent picture of temperature trends during the preceding millennium
...
It can be said with a high level of confidence that global mean surface temperature was higher during the last few decades of the 20th century than during any comparable period during the preceding four centuries. This statement is justified by the consistency of the evidence from a wide variety of geographically diverse proxies.
And they also present charts showing a number of the different sources together, such as:
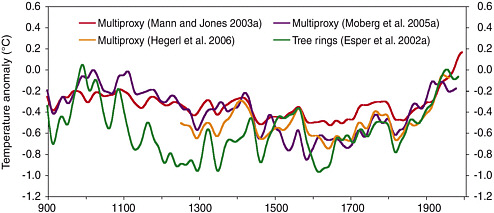
If you want to start debating each of these above studies and arguing their validity and applicability vs Yadav and Singh, we can. (and yes, I understand a good majority of those aren't primarily temperature reconstructions, but rather a context for the ones that are) But don't pretend that you have the definite answer based on one study.
bcglorf wrote:
Also look at the temperature record graphs of the last 1000 years from the 2008 Gussow-Nuna Geoscience Conference. They look absolutely nothing like the radical hockey stick graph Mann et al. try to play up.
link:
http://www.cspg.org/conventions/Gussow2 ... ts/015.pdf
Yeech. You probably should have looked at those charts a little closer before citing these for your argument. Both actually show marked warming in the past 100 years very similar to the hockey stick (approx 1 degree celcius) The trick is the scale (particularily in the first) is very different from the scale used for Mann's classic hockey stick:


Oh, and btw, if you look above, you will see the NAS report did reference the work of this author (Brian Luckman)