Weakness in RF
I was increasing the power of old valve HF transmitters when I was 14. The same age I learnt to program in machine code at a time when that was very esoteric. But it is true I did lots of simple digital electronics before that using bipolar transistors and simple RC timing circuits.
Now as for stats I have always hated them but do not fall into elementary fallacies.
In this case you are taking a large number of correlated measurements (sea height at different places and times). The average of all these is what you want. Added to each measurement there is some error. The key question is whether these errors are correlated?
(1) Yes if there is overall absolute error - but as I said that can be and is calibrated out
(2) Yes if there is quantisation error witout dither. But we know that the measured heights vary a lot, both because of difference in height of different seas and variation due to waves. So because the final result is an average you can treat these variations as you would dither on an a/d converter and the result is to reduce persistent errord due to quantisation.
Otherwise I guess no, in which case the errors reduce relative to the (correlated) signal.
We can go over the math of this if you like!
Tom
Dim Sun Anyone?
After being dragged kicking and screaming. And he delayed for years releasing his code and data. What kind of science is that?They accepted these, corrected their work. The hockey stick BTW is still there - though I can't see why everyone gets so worked up about the shape of a graph. It is easy to get graphs that look impressive by selecting axes correctly!
And it wasn't a bad axis. It was methodological error. The hockey stick was reproduced with red noise. Lots of different examples of red noise. In fact you got the hockey stick without respect to the data ensemble used.
What the H3ll kind of science is that?
And the last IPCC report used that graph a number of times (five or seven) in the report AFTER it was discredited. Once wasn't enough.
What the H3ll kind of science is that?
If this was a commercial venture it would be under investigation for fraud.
Engineering is the art of making what you want from what you can get at a profit.
So you are telling me they use a millisecond by millisecond adjustment for the ionosphere based on millisecond by millisecond calibrations that track the satellite? Pretty good trick.tomclarke wrote:Weakness in RF
I was increasing the power of old valve HF transmitters when I was 14. The same age I learnt to program in machine code at a time when that was very esoteric. But it is true I did lots of simple digital electronics before that using bipolar transistors and simple RC timing circuits.
Now as for stats I have always hated them but do not fall into elementary fallacies.
In this case you are taking a large number of correlated measurements (sea height at different places and times). The average of all these is what you want. Added to each measurement there is some error. The key question is whether these errors are correlated?
(1) Yes if there is overall absolute error - but as I said that can be and is calibrated out
(2) Yes if there is quantisation error witout dither. But we know that the measured heights vary a lot, both because of difference in height of different seas and variation due to waves. So because the final result is an average you can treat these variations as you would dither on an a/d converter and the result is to reduce persistent errord due to quantisation.
Otherwise I guess no, in which case the errors reduce relative to the (correlated) signal.
We can go over the math of this if you like!
Tom
What satellite is flying along? What instrument was being used in the satellite? For the calibration. Of course there is GPS. But those satellites do not follow the altimeter track. There are angular variations. I suppose some kind of tomography would work some. If it was done.
And you have now convinced me that you know enough statistics. So let us leave all the other problems aside. How do you justify 5.6 cm as a significant difference from an instrument only capable of +/- 3.3 cm?
If I was doing a control chart that would be considered within the realm of random variation.
Engineering is the art of making what you want from what you can get at a profit.
It gets even better, the National Snow and Ice Data Center continued throughout this winter to report bad arctic ice data despite being repeatedly and publicly informed that the satellite data they used was corrupted due to degradation of the signal and eventual failure of the channel. Rather than dumping the sensor entirely, they chose to "augment" it with the AMSR-E data, instead of replacing it outright, so they simply interpolated what they felt it should be based upon previous devation between SSM/I and AMSR-E (deviation caused by the gradual degradation of the sensor in the first place) so that they could continue to report below average arctic ice coverage that conformed with their agenda-driven bias and preference for doom and gloom AGW predictions of imminent collapse of the arctic ice cap.
It is now almost June. The sensor on SSM/I stopped reporting in Feb, and they are just now getting around to removing it from their website. Evidently the need to lie to the american public and congress was more important than their scientific integrity.
http://wattsupwiththat.com/2009/05/26/n ... ce-graphs/
I had to comment on climate audit about being reminded of the classic monty python skit about the dead parrot.
Calibration: The oceans are sloshing around. The continents are not stable. And of course calibration only counts when all the confounding factors can be accounted for - ionosphere, clouds (now there is another good one, they are transient on the scale of minutes in some cases), Water vapor (which we understand and measure accurately in the 50 km atmospheric column - that is a joke), etc, etc. etc. And the confounding factors don't change or they can be measured to the required accuracy and accounted for in space and time.tomclarke wrote:Simon -
calibration - they can measure heights relative to other heights, no?
statistics - look again at the issue of correlation (or not) above. Uncorrelated errors are reduced by multiple samples, correlated ones are not.
Errors - yes, you are correct about correlated vs uncorrelated. But how can we be sure which is which? The ocean is sloshing around so you have stuff changing between measurements. It is not like taking a bit of invar into a temp controlled lab and doing multiple laser interferometer measurements on it to get a number.
The measurement today on a rising bit of ocean will not be the same tomorrow when that bit of ocean is falling. Now if we had 50 or 60 satellites following multiple tracks and taking samples continuously we might have a start. What we have is one satellite covering one track. How in the heck can we be sure the ocean is not bulging in one place while dipping in another? How about wind piling up water in one direction and then the wind changes 180 for the nest measurement. Do they actually know the wind speeds over the ocean to the required accuracy for the satellite track? Essentially you are asking me to measure jello in a balloon in a windstorm with variable speeds (winds, tides) with one caliper. I can do it and give you a number with a precision to 10 decimal places with a caliper made of hard rubber. Now tell me what the volume of jello is to 1 part in 10 to the sixth. Now all is not hopeless. Given another 20 or 30 years we may get a number that might mean something. In the mean time you have to say - interesting but not very useful based on the number of assumptions required to get an AVERAGE change over the whole earth. For instance do we really know how tides affect the sloshing in the ocean to the required accuracy? Do we really know the time series so we can correlate measurements thousands of miles and many hours apart?
So yeah. I do believe it may actually be possible for the instrument to read within 3.3 cm any given altitude. So what? That is not the end of the errors. Just the first in the series.
BTW did you note that in the papers you linked the sea level rise was given in one as 3 mm per year and in the other 4 mm a year? Neither of which is catastrophic. Even if they continue. I use the current commonly accepted adjusted number of 3.3 mm a year. Although adjusting for continental rebound seems pointless if you are worried about coastal areas with major population numbers. I wonder how fast the seas are actually rising with respect to where the coasts actually are. Which is the number you really want. If the "scientists" were actually trying to be useful they would give both numbers. I'm sure the numbers with no rebound are not near as scary.
And did you note the Maldives' politicians were trying to extract money from the rest of the world? Which may be influencing their crying in the ocean? Did you note their trying to keep alternate views from their populations? Sounds like they have an agenda.
Engineering is the art of making what you want from what you can get at a profit.
Tom, you seem like a relatively rational and dispassionate AGW believer, so I'm curious -- temps have been flat or declining since 1998, which looks increasingly like an outlier; if temps are flat/declining from 2008-2018, will you become a skeptic on AGW?
What if the trend continues through 2028? 2038?
For my part, I will be less skeptical if at any point satellite-measured temps move rapidly upward to the point they start to look like GCM predictions (though I'll remain skeptical of the consequences being thrown around).
What if the trend continues through 2028? 2038?
For my part, I will be less skeptical if at any point satellite-measured temps move rapidly upward to the point they start to look like GCM predictions (though I'll remain skeptical of the consequences being thrown around).
I was just thinking the very same thing. What physical EVIDENCE will it take to change your mind Tom?TallDave wrote:Tom, you seem like a relatively rational and dispassionate AGW believer, so I'm curious -- temps have been flat or declining since 1998, which looks increasingly like an outlier; if temps are flat/declining from 2008-2018, will you become a skeptic on AGW?
What if the trend continues through 2028? 2038?
For my part, I will be less skeptical if at any point satellite-measured temps move rapidly upward to the point they start to look like GCM predictions (though I'll remain skeptical of the consequences being thrown around).
I understand your position. I was a GW and AGW denier until about 2000. Then I became a believer. That didn't last long. Around 2002 or 2003 I started looking at the papers and taking them more seriously. I became convinced that the whole thing was a government scam designed for wallet extraction.
Take a look at page 26 of this:
http://www.warwickhughes.com/agri/Solar ... ar2_08.pdf
and then tell me exactly what difference cutting USA CO2 emissions to zero by 2020 would make?
And for those who want some amusement have a look at:
http://powerandcontrol.blogspot.com/200 ... -work.html
Engineering is the art of making what you want from what you can get at a profit.
In answer to this question. I am not a "believer". My initial position is one of more trust in the scientific process of peer review and debate than you. It is not that individual scientists are great - but when many different people are all contributing different ideas, the best win over time. And GCMs have had time.
When I look at the evidence now my problem is that this is complex science. The simple-minded blog rebuttals do not stand scrutiny. Equally, I can't rule out completely that all the pro-AGW scientists are somehow deluded / in collusion and getting it wrong.
Clearly the data for warming/cooling is not simple to analyse (take for example the sea-level data, or the horrible surface station data). Few of the sensors were designed to detect fractional degree global temperature change and the one recent satellite that would have helped failed. The anecdotal evidence (do we in the NH think the last few years have been hot or cold) is essentially worthless, partly because it is global temperature which is the issue, and which has less medium term noise than regional temperature.
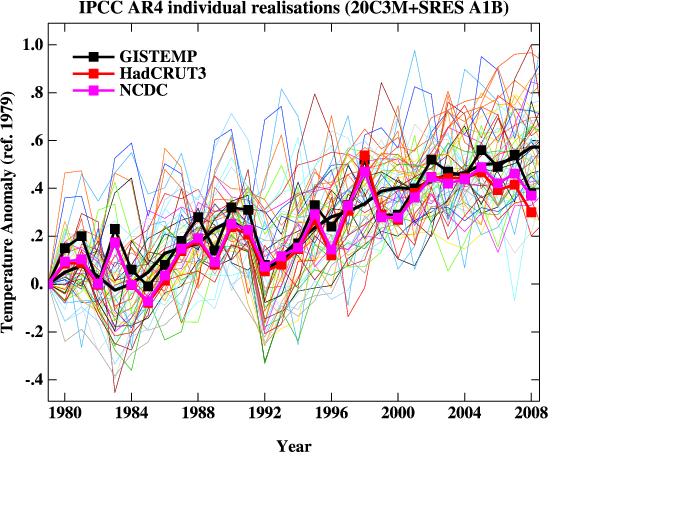
If you look at temperature since 1979 you can see there is a lot of noise. The current temp is at the low end of the moving average - and if it continued with no increase for another 5 years you might doubt the trend. As it stands this data is not (I guess) statistically very significant for a trend though it seems likely there is an upward trend.
So if I had to work out trend based on just this data I would not feel it was sure. The GCMs do not work out trends based on this data. The use all sorts of other data to determine parameters. And my understanding is that they do not determine any parameters from contemporary temperature record. Looking at the noise in this signal it would be difficult to do so.
Similarly - another 5 years will make me more or less happy with 0.2 degrees/decade as a linear trend. But probably this data would not settle it either way.
However the models are getting much more sophisticated. You would expect that they can get some of this fluctuation from independently measurable parameters, ocean currents etc. If they do this well any underlying trend becomes clearer.
I don't know how well they are doing this. Nor do you. Blog comments saying that they are doing it badly for some simple reason are not credible (none of these simple reasons that I have looked at survive close scrutiny). But equally I can't prove that they are doing it well, and not modelling noise, without going into the GCMs in as much detail as the climate scientists.
Now, here are some figures, taken from realclimate (biassed you may think, so we will discuss issues later) comparing the dreaded Hansen's 1988 model projections with global temperature. This comparison is not simple - and anyone who makes it wthout thinking carefully about conditions will make mistakes.
First, all these projected models have as INPUTS the overall climate forcings in the future from GHGs. This is got from the relatively uncontentious proportions of these GHGs in the stmosphere and their raw affect in climate via absorbtion spectra. No assumptions here about H2O amplification, that comes from the models. Hansen proposed three scenarios in 1988 and the one which is more or less correct is B.

Now look at as OUTPUT the projected global temperatures for these three scenarios and the measured global temperature since then:

This was produced a few years ago, and misses the last few (outlying in the cold direction) temperature points. So the pretty good fit over this time period will look less impressive if you add these points.
More recent models are better than these old Hansen projections because:
(1) they model oceans and ocean/atmosphere interaction more precisely
(2) they model vegetation, ice feedbacks more precisely
(3) they have more computer power available, can do ensemble projections with slightly different initial conditions (Simon's Monte Carlo).
Modelling solar input as a forcing is problematic because there is no agreement yet as to what is the overall affect of more/less solar wind. The papers i have seen make this affect a relatively small forcing however.
I am not certain about how the latest models deal with aerosols. As you know there is indisputable evidence that particles in the atmosphere tend to decrease temperature. it is complex - some particles at some heights can have the opposite affect by decreasing albedo - but overall volcanic eruptions make things colder as did industrial emmissions before the major air quality increases of the 1970s. As always take one little bit of this complexity and write it up on a blog and you can argue for the reverse effect!
Recently industrial emmissions from China and India have been rising at a very rapid rate and maybe they are now significant - sorry I will need to do some research to know whether or not this is an issue, and also how it is incorporated into current models. But it was not in Hansen's.
I realise this in no way settles the matter. It leaves me without evidence to change my initial position against the consensus. But it does not either indisputably back the AGW case. You need a lot more detailed consideration of how the projections perform to do that.
The recent deviation towards cold (the last few data points) is interesting. It will be a once in thirty years or more deviation if it continues a few more years. It probably is explainable (if not just a random fluke) it will be interesting to see the explanations. Maybe they will have a significant effect on my view of the overall trend and its cause.
When I look at the evidence now my problem is that this is complex science. The simple-minded blog rebuttals do not stand scrutiny. Equally, I can't rule out completely that all the pro-AGW scientists are somehow deluded / in collusion and getting it wrong.
Clearly the data for warming/cooling is not simple to analyse (take for example the sea-level data, or the horrible surface station data). Few of the sensors were designed to detect fractional degree global temperature change and the one recent satellite that would have helped failed. The anecdotal evidence (do we in the NH think the last few years have been hot or cold) is essentially worthless, partly because it is global temperature which is the issue, and which has less medium term noise than regional temperature.
If you look at temperature since 1979 you can see there is a lot of noise. The current temp is at the low end of the moving average - and if it continued with no increase for another 5 years you might doubt the trend. As it stands this data is not (I guess) statistically very significant for a trend though it seems likely there is an upward trend.
So if I had to work out trend based on just this data I would not feel it was sure. The GCMs do not work out trends based on this data. The use all sorts of other data to determine parameters. And my understanding is that they do not determine any parameters from contemporary temperature record. Looking at the noise in this signal it would be difficult to do so.
Similarly - another 5 years will make me more or less happy with 0.2 degrees/decade as a linear trend. But probably this data would not settle it either way.
However the models are getting much more sophisticated. You would expect that they can get some of this fluctuation from independently measurable parameters, ocean currents etc. If they do this well any underlying trend becomes clearer.
I don't know how well they are doing this. Nor do you. Blog comments saying that they are doing it badly for some simple reason are not credible (none of these simple reasons that I have looked at survive close scrutiny). But equally I can't prove that they are doing it well, and not modelling noise, without going into the GCMs in as much detail as the climate scientists.
Now, here are some figures, taken from realclimate (biassed you may think, so we will discuss issues later) comparing the dreaded Hansen's 1988 model projections with global temperature. This comparison is not simple - and anyone who makes it wthout thinking carefully about conditions will make mistakes.
First, all these projected models have as INPUTS the overall climate forcings in the future from GHGs. This is got from the relatively uncontentious proportions of these GHGs in the stmosphere and their raw affect in climate via absorbtion spectra. No assumptions here about H2O amplification, that comes from the models. Hansen proposed three scenarios in 1988 and the one which is more or less correct is B.
Now look at as OUTPUT the projected global temperatures for these three scenarios and the measured global temperature since then:
This was produced a few years ago, and misses the last few (outlying in the cold direction) temperature points. So the pretty good fit over this time period will look less impressive if you add these points.
More recent models are better than these old Hansen projections because:
(1) they model oceans and ocean/atmosphere interaction more precisely
(2) they model vegetation, ice feedbacks more precisely
(3) they have more computer power available, can do ensemble projections with slightly different initial conditions (Simon's Monte Carlo).
Modelling solar input as a forcing is problematic because there is no agreement yet as to what is the overall affect of more/less solar wind. The papers i have seen make this affect a relatively small forcing however.
I am not certain about how the latest models deal with aerosols. As you know there is indisputable evidence that particles in the atmosphere tend to decrease temperature. it is complex - some particles at some heights can have the opposite affect by decreasing albedo - but overall volcanic eruptions make things colder as did industrial emmissions before the major air quality increases of the 1970s. As always take one little bit of this complexity and write it up on a blog and you can argue for the reverse effect!
Recently industrial emmissions from China and India have been rising at a very rapid rate and maybe they are now significant - sorry I will need to do some research to know whether or not this is an issue, and also how it is incorporated into current models. But it was not in Hansen's.
I realise this in no way settles the matter. It leaves me without evidence to change my initial position against the consensus. But it does not either indisputably back the AGW case. You need a lot more detailed consideration of how the projections perform to do that.
The recent deviation towards cold (the last few data points) is interesting. It will be a once in thirty years or more deviation if it continues a few more years. It probably is explainable (if not just a random fluke) it will be interesting to see the explanations. Maybe they will have a significant effect on my view of the overall trend and its cause.
Last edited by tomclarke on Fri May 29, 2009 4:44 pm, edited 1 time in total.
Todd Friesen at realClimate wrote: I’ve been running some 30 year linear regression models based on GISS, Hadley, RSS, and UAH, inputting variables for volcanic (GISS), solar forcing (Satellite), ENSO (NOAA), and Net Anthropogenic forcing (GISS data).
I found that with the 30 year time period, the solar trend is only a slight negative, ENSO is also sloped with a slight negative trend. I think volcanic forcing is on a warming trend, because volcanic activity is weighted towards the beginning of the 30 year period. So, I think my regression shows that Anthropogenci warming contributes to about 0.13C/decade out of the total 0.16C/decade (about 0.04C due to volcanic, and -0.01 due to solar and ENSO combined). Hadley had virtually the same results. RSS had just under 0.11C, and UAH had about 0.08C due to anthropogenic forcing. I also noticed that RSS and UAH had greater sensitivity to ENSO and volcanic forcings (I think it was about 50% larger sensitivity).
Anyway, Gavin, I’m wondering if these findings are similar to the ones you have in understanding the last 30 years, regarding the relative forcing contributors to the 30 year temperature record. You mentioned 0.2C per decade, but I’m not sure if this was a forecast or a current trend.
Jonas B at RealClimate wrote: So now you have shown that the last 10 years flattish trend is not significantly different from models, because models have great variability. Fair enough!
Since models have this variability, why is it that measured trends are calculated for only 30 years? By doing this, you always include the exceptional warming roughly between 1978 to 1998.
Isn’t it more fair to include even more years, for example the last 100 years? If so, the trend would be some 0.7 deg C.
[Response: The longer the period, the less important the annual variability. So the 100 year trend is a useful guide, though you have to be careful since the expected change over 100 years isn’t perfectly linear. Over the last 30 odd years it is much closer to linear, and so linear trend analysis is a little more appropriate. - gavin]
John Finn at RealClimate wrote: GISTEMP 1984-2008 0.19+/-0.05 (LO-index)
1. So the 1984-2008 is not significantly different to the trends of a number of pre-1945 25 year periods (e.g. 1916-40, 1917-41)
2. 1984 does appear to be a GISS local minimum - why was this year chosen.
[Response: That’s when the Hansen et al runs were started (and where the forcing was a projection, rather than known already). - gavin]
3. Temp trends which which begin before 1993/94 and after ~1981 are affected by the Pinatubo cooling (admittedly less so in the early 1980s than later). If the Pinatubo effect was removed, trends that begin in the post-1980s period would be remarkably similar to thosethat begin in the pre-1920 period.
There’s clearly something else going on here. CO2 levels were completely different; Leif Svalgaard maintains there is very little solar effect - so, as Timo in #3 says, ocean circulation must be a big player.
[quote="RichardC at RealCilate""] Says:
16 December 2008 at 6:31 PM
Solar variability on human timescales is the 9-14 year (nominally 11) cycle. The SORCE satellite is the current best measurement of solar output (It’s been dropping ever since launch in 2003 - down almost 1 watt/m2) http://lasp.colorado.edu/sorce/total_so ... 40×480.png
Weather variability? Yes, global warming increases absolute humidity so more extreme weather incidents are expected - as in more downpours and fewer drizzles.[/quote]
Todd Friesen at RealClimate wrote: 16 December 2008 at 8:02 PM
John #19,
Volcanic activity is indicated by Stratospheric Aerosol forcing in the link below.
http://data.giss.nasa.gov/modelforce/RadF.txt
There’s more than just Pinatubo to consider in the 30 year trend. There was sigificant strato-volcanic forcing data in 1982 and 1983. This partly explains why 1984 was a local minimum. (My model suggests a lag between volcanic forcing and temperature change of 1 or 2 years). This has more of an effect on the 30 year trend than Pinatubo because the effects of Pinatubo are around the middle of the time period. With a 1984 starting point, Pinatubo will have some effect, though maybe not substantial. I quantified the volcanic bias to account for about 0.04C/decade of the 0.16C/decade trend (global GISS land+ocean starting 1979). ENSO and solar have a slight negative slope.
I think it is clear that ocean oscillation is a significant factor, and helps explain some of the anomalies along the way. It may even help explain (in part) some 30 year trends. The last 30 years, though, it seems to have had a slight negative effect.
If you are looking at a 100 year trend, looking at the PDO data, I don’t think it contributes much to the slope, and if it does, I can’t tell which direction. A 60 year trend, maybe a little upward movement. It’s pretty much certain that the long term trend isn’t explained all that much by ocean oscillations.
I think a large majority of the long-term trend (i.e. 100 years) is explained by anthropogenic warming. Whenever I try to model 30 year or 130 year trends, the fit is quite horrible without including anthropogenic forcings. With Anthropogenic forcings, it’s quite amazing how well the temperature series fits. Maybe it’s just correlation. I think when you couple sound physical science theory with supporting statistial correlation, you have a fairly credible theory.
OK - these various posts are all in response to a realClimate post discussing the 1998-2008 ten year trend, and comparing it with a few other baselines for trends. They do not strile me as being written by "believers". I like RealCilate precisely because you don't get one dried blog opinion - you get many different viewpoints.
These people may be all part of the conspiracy...?
Or maybe they are all fooled by the same contaminated data...?
Tom
BTW - you need to be careful with figures. Solar output down 1W/m^2 DOES NOT mean a climate forcing of 1W/m^2. It must be divided by:
Factor of 3 or so (sorry can't do the integral in my head) for the fact that radiation is incident on only half the sphere, and that at an angle.
Factor of something because of heat reflected back to space.
But when you read a blog comment on this will you remember the necessary large correction factor? If not you may agree with arguments which say that solar forcing is very significant compared with other forcings...
EDIT - sorry I was being stupid, the geometric factor is trivially pi*r^2/4*pi*r^2 = 1/4!
Sorry for those who do not like these comments - but i find them fascinating:
wayne davidson at RC wrote::
17 December 2008 at 2:04 AM
#29 and 30
It affects Arctic temperature like this:
64-90 N Temperature anomalies (NASA GISS)
2001 102
2002 126
2003 122
2004 77
2005 223
2006 191
2007 211
That is an average of 1.5 C with a definite upward trend
Contrarians eager to use temperature trends to earn no respect, love the 40’s or 30’s explaining away a mysterious cycle:
1943 132
1944 115
1945 61
1946 4
1947 111
1948 23
1949 34
average temperature anomaly of +0.69 C. 33-39 is +0.74 anomaly
so the cycle misses a doubling of sorts.
I am a rabid proponent for worldwide DWT charts, they will come one day… Just a fan of the surface temperature trend because there is nothing else as frequently used. Past November was warm:
http://data.giss.nasa.gov/cgi-bin/giste ... 00&pol=reg
Not much “blue” in the Arctic (not with urban heat islands or heavy industries) with a mean zonal anomaly of +4 C near the Pole. Along with that
the ice is substantially thinner due to clouds, and 2008 will have the same extent of 2007 likely soon. Its another December when it gets -40 C well south of the warmer Arctic as well.
Alistair McDonald wrote:]But Gavin is starting his meteorological new year on the 1st December. What he is doing is using cherry picked dates to suit his arguments. The official start of the meteorological New Year is 1st December, and the official start of this century was not the day on which the Millennium was celebrated. It is the 1st Jan 2001.
Why is this important? Because it makes it look as if Gavin can only answer the problem of why global warming seems to have stalled by fiddling the statistics. So he is giving heart to the sceptics, not defeating them.
But it is also symptomatic of a much bigger problem. The upper troposphere is not warming in the way the models predict, but rather than listen to criticisms of the models he has been a contributing author to a series of papers which use dubious statistics to “prove” that the models are correct.
In the latest of these Figure 6″ clearly shows little correlarion between any of the MSU and radiosonde data and the multi-model average (thick black line.) Only by adding a new set of MSU data RABCORE, which itself does not lie within the standard deviation in the upper troposphere, is the data made to look as if it averages out to meet the models. It is a case of two wrongs matches: radiosonde data and RAOBCORE calculations, being made to look like a the required match: multi-model average. But it is only the radiosonde date that is correct. That is what is measured. If the models do not agree then they are wrong!
Cheers, Alastair.
John Finn wrote: # John Finn Says:
17 December 2008 at 8:34 AM
[Response: That’s when the Hansen et al runs were started (and where the forcing was a projection, rather than known already). - gavin]
Ok fair enough, thanks. I did vaguely remember something about this but it came to me after I’d posted the message. But , as Todd in #23 points out, 1984 could have been affected by the El Chichon eruption which means that the early part of the 1984-2008 period was affected by 2 volcanic eruptions which must influence the trend.
Re: #23
Todd
I’m not sure how you are including the PDO in your model, but Spencer (and others) has shown that PDO can be significant and may explain much of the 20th century warming.
In your post, you write
If you are looking at a 100 year trend, looking at the PDO data, I don’t think it contributes much to the slope, and if it does, I can’t tell which direction. A 60 year trend, maybe a little upward movement. It’s pretty much certain that the long term trend isn’t explained all that much by ocean oscillations.
A couple of things to say here:
1. The 100 year trend is only 0.07 deg/decade anyway so I wouldn’t expect the PDO long term trend to contribute much. It’s surely the periods where the trend is amplified which are of interest…..
2. We appear to have had 3 PDO shifts in the past 100 years, i.e. 2 cool->warm and one warm->cool which coincided exactly with the 2 strong warming periods and the mid-20th century cooling (or non-warming) period.
Note the term PDO is used above as a generic term for ocean oscillation.
Re: #32
Wayne Davidson
I don’t think anyone is suggesting that there isn’t an AGW signal – just that it’s nowhere near as large as generally claimed.
RichardC at RD wrote: 17 December 2008 at 11:08 AM
46 ccpo says, “So, when 9 of the top ten warmest years have all been in the last 10 or 11 years, that’s a very large signal, particularly since it sits at the end of a very long upward trend.”
The skeptics’ point is simple: The alarmists’ admit that the first half of the 20th century can be largely explained by natural variability - solar, etc. So plot a sin curve over the last 50 years. It sure looks like we’re simply at the peak of a natural curve, doesn’t it?
There will be no consensus amongst the general population until the above argument is destroyed - not with scientific “mumbo-jumbo”, but actual disastrous data. The arctic sea ice will ~finish melting and then everyone will agree. Two to four years should be long enough. Then we’ll start brimstoning the atmosphere and merrily keep tossing CO2 as the problem will be “solved”.
Sorry - can't resist this:
# John Finn Says:
17 December 2008 at 12:12 PM
Re: #47
Wayne
The GISS trend at the Arctic was about the same for the 1910-35 period as it was for the 1978-2007 period. Admittedly the starting point in 1978 was higher than it was in 1910 so the final temperatures (as you pointed out) ends up higher in 2007 than in 1935. But the Arctic warmed at pretty much the same rate. Unfortunately, the long-term surface records are the only comparisons we can make because there were no satellites in 1910, so we have no way of knowing what the Arctic troposphere temperatures were back then.
I’m not sure if this addresses any of your points, since you seem to be attributing comments to me which I never made.
Between 1935 and 2007, the Arctic appears to have warmed about half a degree which, in the absence of any other proven cause, I’ve assumed is due to increased GHGs. Though I wouldn’t be surprised if there’s a solar signal in there as well. After all, the 3 strongest solar cycles ever recorded all occurred in the second half of the 20th century. Whether, its GHGs or solar, I’m not convinced a ~0.5 deg increase in 70 years is particularly alarming.
# tamino Says:
17 December 2008 at 1:30 PM
Re: #51 (John Finn)
Between 1935 and 2007, the Arctic appears to have warmed about half a degree…
Looks to me like it’s closer to a full degree. The 5-year average centered on 1935 is 0.518, the 5-year average centered on 2005 (the most recent available) is 1.636 — a difference of 1.118 deg.C.
Even if you take the highest 5-yr average from the first half of the 20th century (centered on 1945), it’s still only 0.808, fully 0.828 deg.C less than the most recent 5-yr average.
The net warming of the arctic over the entire time span of GISSTEMP data is OVER 2.5 deg.C.
You’ve lived up to your usual habit by fulfilling the prophecy of this post’s title: spin.