Re: Lindzen ppt link above. An explanation:
http://www.di2.nu/200906/02a.htm
i.e. data vs models.
Dim Sun Anyone?
Simon -
I am going to give you aboring, not very detailed response to your two big issues first. it may be wrong. I have not researched it.
There are we know many variable factors which force global temperature. the two you are interested in:
1. ENSO state => El Nino/ La Nina
2a Sunspot cycle (solar irradiance)
2b Sunspot cucle (GCR)
GCR and solar irradiance correlate strongly but are not quite identical (I have a paper about chasing the differences).
Now. No-one is saying these do not affect global temp. Clearly they do. I take your point that any variability which has a period of say 150 years and therefore changes linearly over the last 80 years is a candidate for causing the observed temperature trend that everyone else attributed to CO2.
If these forcing factors have a significant linear component over this timescale then your worries are founded and until the magnitude of their effect can be determined, or at least bounded, they could be doing the stuff.
Actually solar irradiance can be bounded since the forcing effect is known precisely and can be compared with the forcing effect of CO2. No uncertainty there. the uncertainty comes from how these forcing effects are amplified by feedbacks, specifically by H2o feedback and clouds etc.
But both GCR and ENSO are problematic, because we cannot determine what is their forcing effect on the climate except through the temperature record.
What we can say, however, is that neither has a linear trend. GCR very clearly follows sunspot cycle with no obvious linear trend but a very obvious 11 year cycle. This can be detected in the temperature record and a limit put on any linear trend. The Climax GCR record clearly has no discernable linear trend in any case. So this does not seem an adequate way of explaining the (linear) temperature trend over this period.
ENSO is more complex because chaotic. But it is certainly not linear trending over the 80 year period. I will need to do some more research to check this but is is easy to put some sort of bound on this.
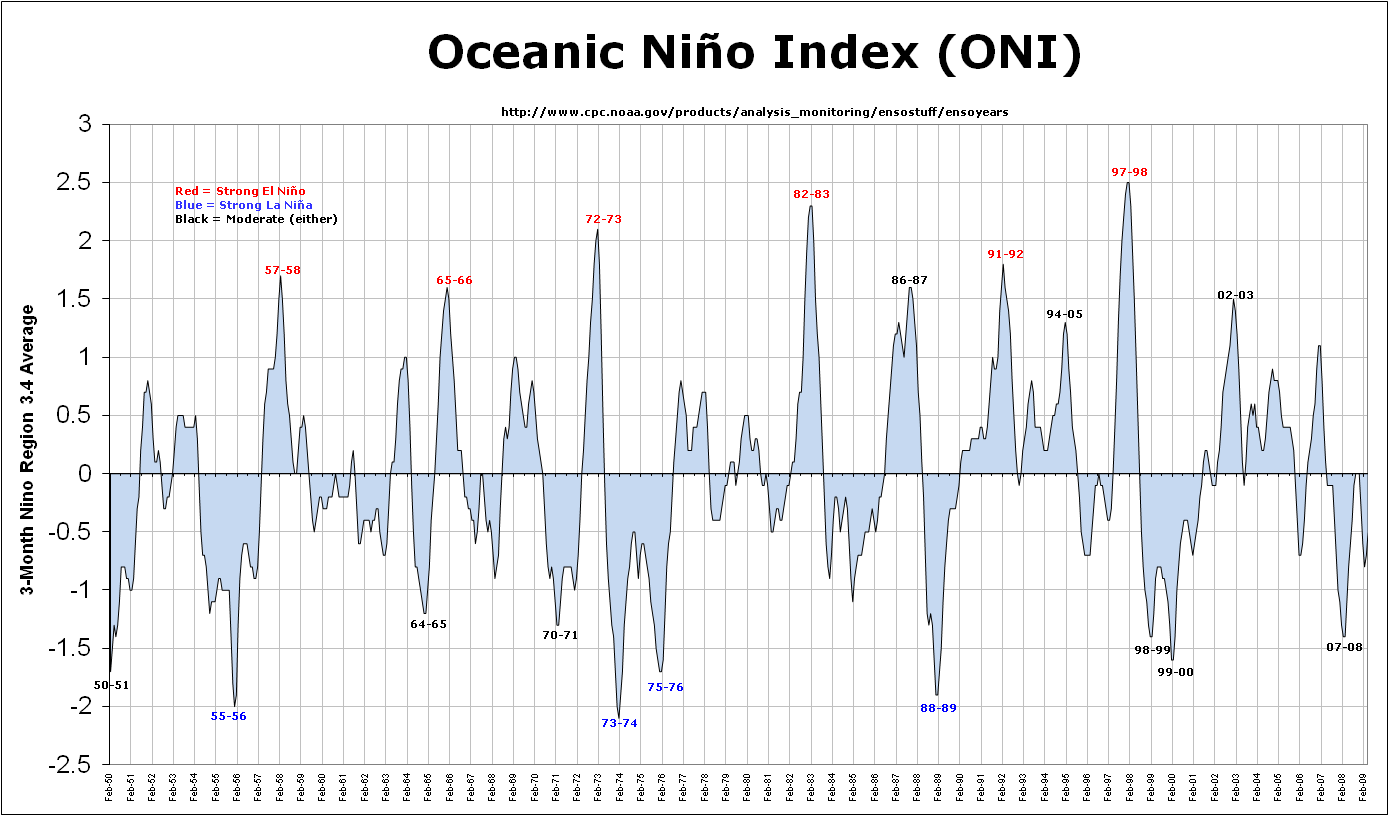
The argument for NOT subtracting these effects is that we do not accurately know how much or in what way they effect global temperature. The -0.7C is called the Oceanic Nino Index:
http://www.cpc.noaa.gov/products/analys ... ears.shtml
And for the last 60 years:
http://ggweather.com/enso/ONI.png
But this index is simply the local SST readings reading anomaly relative to global annualised average temperatures. It represents something, but how it feeds into global temperature is not well defined. Nor is the index. there are many local readings that correlate with El Nino/La Nina events and what combination of them to choose is arbitrary.
To get the global effect you have to do stochastic modelling assuming say a linear relationship between the ENSO index (there are some 20 correlated local parameters, so which do you use?) and global temperature. It increases the number of parameters enormously. Most importantly these extra parameters can't be determined physically from anything other than the temperature record. Therefore correcting for them is (as a matter of stochastic modelling theory) a BAD IDEA. I am sure you know this.
However you could take some arbitrary index, like the ONI, and decorrelate that from the global trend. This would possibly give less variance in the signal, and you are adding only one stochastically determined parameter, but since the ONI does not trend linearly (at least it has no obvious linear trend I can see) it would not change the CO2 forcing correlation much.
Given all these parameters I am sure it is possible to construct an ENSO index which will trend however you want! So if somone constructs (arbitrarily) an ENSO index which just happens to have a linear trend you should be very suspicious. There are an awful lot of parameters to choose such an index from, and with so many degrees of freedom anything can be constructed.
Without looking at magnitudes we have not proven that the ENSO signal is not a problem. But we can see your suggestion for de-trending is bad and can be used (by suitable arbitrary choice of index to represent the ENSO phenomena) to do anything.
OK - for more than this I need to do some proper research. Tom
PS - the above is my analysis based on a rather superficial reading of the data - it may be incomplete/wrong/etc. I don't know what RC would say!
I am going to give you aboring, not very detailed response to your two big issues first. it may be wrong. I have not researched it.
There are we know many variable factors which force global temperature. the two you are interested in:
1. ENSO state => El Nino/ La Nina
2a Sunspot cycle (solar irradiance)
2b Sunspot cucle (GCR)
GCR and solar irradiance correlate strongly but are not quite identical (I have a paper about chasing the differences).
Now. No-one is saying these do not affect global temp. Clearly they do. I take your point that any variability which has a period of say 150 years and therefore changes linearly over the last 80 years is a candidate for causing the observed temperature trend that everyone else attributed to CO2.
If these forcing factors have a significant linear component over this timescale then your worries are founded and until the magnitude of their effect can be determined, or at least bounded, they could be doing the stuff.
Actually solar irradiance can be bounded since the forcing effect is known precisely and can be compared with the forcing effect of CO2. No uncertainty there. the uncertainty comes from how these forcing effects are amplified by feedbacks, specifically by H2o feedback and clouds etc.
But both GCR and ENSO are problematic, because we cannot determine what is their forcing effect on the climate except through the temperature record.
What we can say, however, is that neither has a linear trend. GCR very clearly follows sunspot cycle with no obvious linear trend but a very obvious 11 year cycle. This can be detected in the temperature record and a limit put on any linear trend. The Climax GCR record clearly has no discernable linear trend in any case. So this does not seem an adequate way of explaining the (linear) temperature trend over this period.
ENSO is more complex because chaotic. But it is certainly not linear trending over the 80 year period. I will need to do some more research to check this but is is easy to put some sort of bound on this.
The argument for NOT subtracting these effects is that we do not accurately know how much or in what way they effect global temperature. The -0.7C is called the Oceanic Nino Index:
http://www.cpc.noaa.gov/products/analys ... ears.shtml
And for the last 60 years:
http://ggweather.com/enso/ONI.png
But this index is simply the local SST readings reading anomaly relative to global annualised average temperatures. It represents something, but how it feeds into global temperature is not well defined. Nor is the index. there are many local readings that correlate with El Nino/La Nina events and what combination of them to choose is arbitrary.
To get the global effect you have to do stochastic modelling assuming say a linear relationship between the ENSO index (there are some 20 correlated local parameters, so which do you use?) and global temperature. It increases the number of parameters enormously. Most importantly these extra parameters can't be determined physically from anything other than the temperature record. Therefore correcting for them is (as a matter of stochastic modelling theory) a BAD IDEA. I am sure you know this.
However you could take some arbitrary index, like the ONI, and decorrelate that from the global trend. This would possibly give less variance in the signal, and you are adding only one stochastically determined parameter, but since the ONI does not trend linearly (at least it has no obvious linear trend I can see) it would not change the CO2 forcing correlation much.
Given all these parameters I am sure it is possible to construct an ENSO index which will trend however you want! So if somone constructs (arbitrarily) an ENSO index which just happens to have a linear trend you should be very suspicious. There are an awful lot of parameters to choose such an index from, and with so many degrees of freedom anything can be constructed.
Without looking at magnitudes we have not proven that the ENSO signal is not a problem. But we can see your suggestion for de-trending is bad and can be used (by suitable arbitrary choice of index to represent the ENSO phenomena) to do anything.
OK - for more than this I need to do some proper research. Tom
PS - the above is my analysis based on a rather superficial reading of the data - it may be incomplete/wrong/etc. I don't know what RC would say!
OK - Linzen's rehash of his argument re climate sensitivity & climate models.
I read it. Sounds compelling. Hey - here is somone who's 1st year university control theory is as good as mine! (Not much of a recommendation). I went to a better written source - the well-known Spencer:
http://www.drroyspencer.com/research-ar ... -evidence/
This at least is a scientific argument to get our teeth into.
It requires some work to debunk it. Spencer is renowned for analyses which are just completely wrong - but that does not mean this one is. But the data he uses, and its interpretation - is v complex. Just like Simon I tend to distrust things neatly wrapped. And these graphs of Lindzen leave too many loose ends, with too little explained. So I will leave this for a little. Clearly - if the Spencer/Lindzen argument can be proven, it is strong evidence for low climate sensitivity. This would raise many other questions - but certainly make everyone rethink whether GCMs are right.
Instead I though I would look for the most solid evidence for climate sensitivity. Lindzen & Spencer are right - this is a key parameter. Negative, as Lindzen claims - and we can all go back to driving coal-powered SUVs.
Here is a decent review by Tung 2007:
http://www.amath.washington.edu/researc ... ar-jgr.pdf
He notes that many of the climate sensitivity estimates come from models, either GCMs or from theory dependent on some model. Both suspect.
He looks also for model-independent measures of climate sensitivity, and obtains limits of 2.3-4.1C/W/m^2 from a number of methods.
Tung decorrelates the very strong and well-defined periodic solar irradiance cycle from the global temperature record to obtain a bound of 3+/-0.7C KW^-1m^2 sensitivity to warming. (It is a lower bound because the long-term sensitivity may be larger, on the other hand 11 years seems enough for this to be a decent bound).
This is a clever agrument, and though Tung cites many other studies, some model-independent, which constrain climate sensitivity I like this one best.
There is however one potential hole in his derivation which I expect Simon will comment on immediately.
If these forcing factors have a significant linear component over this timescale then your worries are founded and until the magnitude of their effect can be determined, or at least bounded, they could be doing the stuff.
Tom, Tom, Tom,
(I guess the natives are restless)
1. We know the PDO/ENSO operates on 30/60 year time scales. The CO2 "forcing" has only come into vogue during the PDO positive period. No compensation of that CO2 "forcing" number has been made for the KNOWN PDO/ENSO effect. Thus it is too high. Maybe way too high.
2. The satellite data for sea level is only 17 years long and has not been compensated for KNOWN decadal internal variation. It too is mostly in the PDO/ENSO positive period.
The ERBE satellite shows the feedback from a temp rise is negative. The models all have it positive.
There for one can adduce that the data is wrong and the models are right.
I surrender to the weight of paper.
Engineering is the art of making what you want from what you can get at a profit.
Ya got me Tom. I have no argument. The PDO/ENSO is not important and no correction is needed the models are good enough and governments should rely on them to raise taxes as much as they need.tomclarke wrote:We know the PDO/ENSO operates on 30/60 year time scales.
Evidence? (something written with references to validate statements made but not proven in text would be nice. You know, the sort of thing I ask my students to do when writing an argument).
Tom
Engineering is the art of making what you want from what you can get at a profit.
Right on. That is a wonderful argument. Anything we don't fully understand we should dismiss.But both GCR and ENSO are problematic, because we cannot determine what is their forcing effect on the climate except through the temperature record.
Well. I'll tell you what. I really don't fully get CO2 AGW. So I'm dismissing it.
From now on I'm just taking the words of experts I trust. Lindzen and Svensmark seem pretty trustworthy to me. They don't want to kill anyone dependent on fossil fuels so I'm going with them. My mother is old and frail and lives on a fixed income. If government raises her costs of living too much they will kill her. I'm against that.
How you can support that Hansen feller who wants to kill my mother in the cold Nebraska winters is beyond me.
Engineering is the art of making what you want from what you can get at a profit.
The leopard reveals his spots: character-based science.
This is an issue - like most when you get doen to specifics - of scientific plausibility. I don't know which way it will go because I have not done the detailed work yet. Given my naive initial state of thinking the consensus science view probably right I guess it will go my way. But that won't influence what I do.
Let me summarise the issue. We have undisputed global average temperature graph over 80 years:

We have indisputed radiative forcing for various different sources:

We have climate sensitivity (to these forcings) which is disputed.
We have natural variability from ocean currents on decadal timescale whose overall effects on global temperature are real but of unclear magnitude (X).
We have a suggestion that GCR levels (modulated by sunspot cycle like solar irradiance but not identical to it) could have a significant effect on low cloud cover an therefore act as an additional forcing (perhaps technically not but you can think of this a forcing). Call it Y. You can't simply disambiguate this since GCR correlate with solar irradiance which itself can affect cloud cover - but if there is an effect careful science will be able to locate and validate it . Svengali has hypnotised sections of the media by showing that GCR->clouds is possible experimentally. This is interesting (not surprising) work. He then adds on a whole load of climate science arguments which are not substantiated by his data.
The big advantage of all the radiative forcings is that the relative amplitude of each is determined by physics independent of the temperature record and therefore known. There is ONE unknown parameter - climate sensitivity. This can be estimated stochastically by comparing sum of forcings with temp record.
Now there may be other forcings which matter, and reduce accuracy of the above estimation. Specifically, X, Y above. If either of these is mostly linear it could easily be confused with CO2 forcing.
Y we have already considered. The best estimate of it is the Climax GCR count, with sunspot cycle periodicity and no linear component.
X is more complex. There are two distinct effects have been identified (X1: ENSO Nino vs Nina and X2: PDO). each of these effects is not a real number. It is constructed from measurements of anomalies in local sea temperatures suitable averaged and obviously is not a unique index. you can put the raw figures together choosing different ones in different ways to obtain many different possible single parameters.
This is a recipe for fraud. Easy for somone with an agenda to concoct a compound parameter representing one or both of these two effects which has the overall characteristics they want. There are maybe 20 physical parameters each correlated with the ocean phenomena, and no obvious way to decide which to choose or how to weight them. In this case an overall linear trend would raise possibility that this not the above forcings was causing the global temp graph.
Well, here is the "standard" PDO parameter. Of course it may have been concocted. But it shows no linear dependence with time and does not seem needed to explain global temperature trends once all the other forcings are decorrelated (remember only ONE free parameter necessary for this decorrelation).

Smoothed:
 [/img]
That from the independent-minded engineer who is prepared to challenge any view of it seems fishy?From now on I'm just taking the words of experts I trust. Lindzen and Svensmark seem pretty trustworthy to me.
This is an issue - like most when you get doen to specifics - of scientific plausibility. I don't know which way it will go because I have not done the detailed work yet. Given my naive initial state of thinking the consensus science view probably right I guess it will go my way. But that won't influence what I do.
Let me summarise the issue. We have undisputed global average temperature graph over 80 years:
We have indisputed radiative forcing for various different sources:
We have climate sensitivity (to these forcings) which is disputed.
We have natural variability from ocean currents on decadal timescale whose overall effects on global temperature are real but of unclear magnitude (X).
We have a suggestion that GCR levels (modulated by sunspot cycle like solar irradiance but not identical to it) could have a significant effect on low cloud cover an therefore act as an additional forcing (perhaps technically not but you can think of this a forcing). Call it Y. You can't simply disambiguate this since GCR correlate with solar irradiance which itself can affect cloud cover - but if there is an effect careful science will be able to locate and validate it . Svengali has hypnotised sections of the media by showing that GCR->clouds is possible experimentally. This is interesting (not surprising) work. He then adds on a whole load of climate science arguments which are not substantiated by his data.
The big advantage of all the radiative forcings is that the relative amplitude of each is determined by physics independent of the temperature record and therefore known. There is ONE unknown parameter - climate sensitivity. This can be estimated stochastically by comparing sum of forcings with temp record.
Now there may be other forcings which matter, and reduce accuracy of the above estimation. Specifically, X, Y above. If either of these is mostly linear it could easily be confused with CO2 forcing.
Y we have already considered. The best estimate of it is the Climax GCR count, with sunspot cycle periodicity and no linear component.
X is more complex. There are two distinct effects have been identified (X1: ENSO Nino vs Nina and X2: PDO). each of these effects is not a real number. It is constructed from measurements of anomalies in local sea temperatures suitable averaged and obviously is not a unique index. you can put the raw figures together choosing different ones in different ways to obtain many different possible single parameters.
This is a recipe for fraud. Easy for somone with an agenda to concoct a compound parameter representing one or both of these two effects which has the overall characteristics they want. There are maybe 20 physical parameters each correlated with the ocean phenomena, and no obvious way to decide which to choose or how to weight them. In this case an overall linear trend would raise possibility that this not the above forcings was causing the global temp graph.
Well, here is the "standard" PDO parameter. Of course it may have been concocted. But it shows no linear dependence with time and does not seem needed to explain global temperature trends once all the other forcings are decorrelated (remember only ONE free parameter necessary for this decorrelation).
Smoothed:
[/img]
Last edited by tomclarke on Wed Jun 03, 2009 9:30 am, edited 5 times in total.
Well you like "Auschwitz Trains" Hansen.
Perhaps you would like to comment on why the satellite data goes one way and ALL the models go another:
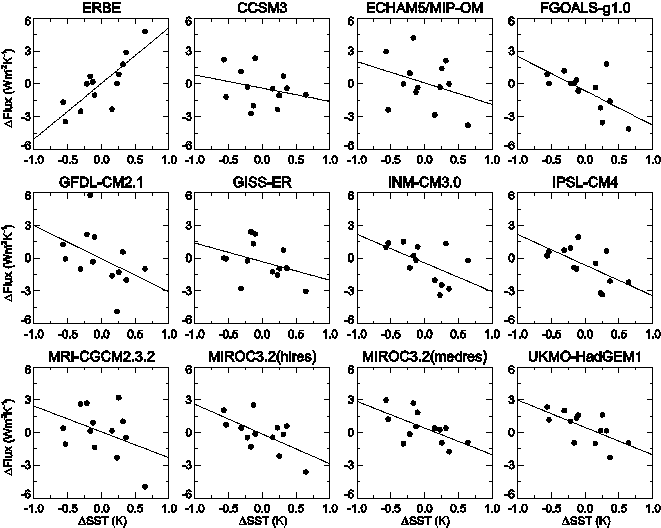
No doubt there is a paper explaining why the models are right and the data is wrong.
from:
http://www.di2.nu/200906/02a.htm
Graph added:
from:
http://wattsupwiththat.com/2009/06/02/l ... ne-2-2009/
Perhaps you would like to comment on why the satellite data goes one way and ALL the models go another:
No doubt there is a paper explaining why the models are right and the data is wrong.
from:
http://www.di2.nu/200906/02a.htm
Graph added:
from:
http://wattsupwiththat.com/2009/06/02/l ... ne-2-2009/
Engineering is the art of making what you want from what you can get at a profit.
Tom,
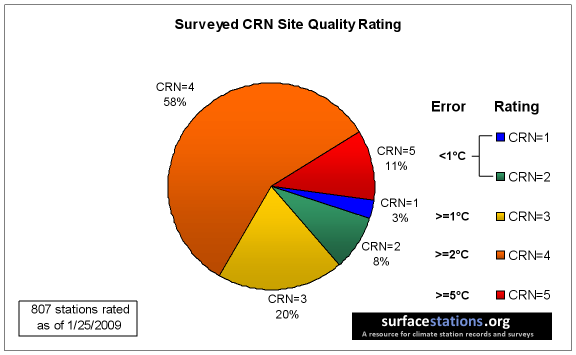
The land data as you very well know comes from a really poor set of observing stations in the USA. And the USA is acknowledged to be the best in the world.
The blue dots are good. The green dots are acceptable all the rest are suspect or worse:
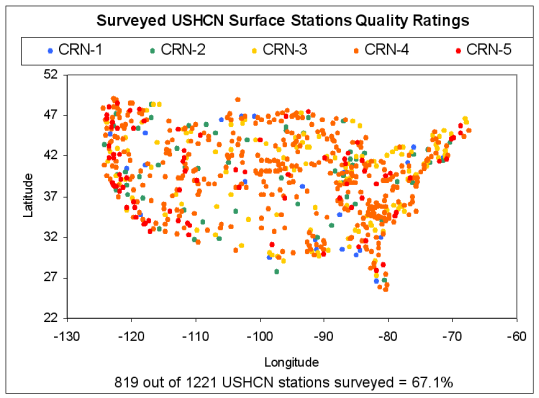
Here is a nice one:
http://gallery.surfacestations.org/main ... itemId=831
From:
The land data as you very well know comes from a really poor set of observing stations in the USA. And the USA is acknowledged to be the best in the world.
The blue dots are good. The green dots are acceptable all the rest are suspect or worse:
Here is a nice one:
http://gallery.surfacestations.org/main ... itemId=831
From:
Engineering is the art of making what you want from what you can get at a profit.
No comment without much more precise information about what are the datasets, how are they processed. Etc. you know how easy it is to cook figures!
In particular I think there is a subtle issues of causality - so no comment until I know precisely what these graphs mean.
Would you say my previous post is a fair summary of the issues? You want to explain the temp rise using some other forcing:
PDO
GCR
(ENSO?)
If these duplicate the CO2 linear rise AND are large in magnitude you can argue CO2 sensitivity is low.
The best attempt to do this I have seen comes from Bob Tisdale's blog. He does not of course say this is watertight but he leaves out the VERY OBVIOUS error.
http://bobtisdale.blogspot.com/2009/04/ ... -2002.html
But the graphs look very impressive!
How about this:
No GCMs (Simon does not like them).
A)
Data: global temp record 1880-2009
B)
Measured & knowable forcings:
CO2&GHGs/solar irradiance/volcanos/industrial aerosols
C)
unclear forcings:
GCRs (50 years data from Climax)
PDO/ENSO (?years data from local sea temperatures)
climate sensitivity: scales all the B) forcings equally, free parameter.
C variables: can add extra parameters as necessary to try to explain global temp trend from some combination of these and known forcings.
The question is what is the simplest theory - climate sensitivity value + (possibly) parameters scaling the PDO/ENSO/GCR contributions - which explains the observed temperature record. Simplest = smallest number of non-zero parameters (that is not quite the correct metric, but it is a decent approximation).
In fact, given this structure - we could do a full quantitative Baysian model comparison! All this without needing a single GCM.
Best wishes, Tom
He was just doing what you did. So you can't condemn him for following your example.tomclarke wrote:The leopard reveals his spots: character-based science.
That from the independent-minded engineer who is prepared to challenge any view of it seems fishy?From now on I'm just taking the words of experts I trust. Lindzen and Svensmark seem pretty trustworthy to me.
Actually, there is a lot of disputability here.
This is an issue - like most when you get doen to specifics - of scientific plausibility. I don't know which way it will go because I have not done the detailed work yet. Given my naive initial state of thinking the consensus science view probably right I guess it will go my way. But that won't influence what I do.
Let me summarise the issue. We have undisputed global average temperature graph over 80 years:
Firstly check out the quality of the surface stations where the data comes from: http://www.surfacestations.org
The overwhelming majority of surface stations have excessive development around them causing heat island effects far in excess of those admitted to by the Hockey Team.
Secondly: Chart out the satellite temperature record, and plot some lines when the record changed from one satellite to another. You'll find some significant changes from satellite to satellite
Thirdly: Those pretty charts they are putting out are plotting data massaged in the wrong direction. Rather than dropping modern temps down to compensate for heat island effects, they drop down older temps when there was less heat island, thus falsely exacerbating apparent warming.
We have indisputed radiative forcing for various different sources:
We have climate sensitivity (to these forcings) which is disputed.
We have natural variability from ocean currents on decadal timescale whose overall effects on global temperature are real but of unclear magnitude (X).
We have a suggestion that GCR levels (modulated by sunspot cycle like solar irradiance but not identical to it) could have a significant effect on low cloud cover an therefore act as an additional forcing (perhaps technically not but you can think of this a forcing). Call it Y. You can't simply disambiguate this since GCR correlate with solar irradiance which itself can affect cloud cover - but if there is an effect careful science will be able to locate and validate it . Svengali has hypnotised sections of the media by showing that GCR->clouds is possible experimentally. This is interesting (not surprising) work. He then adds on a whole load of climate science arguments which are not substantiated by his data.
The big advantage of all the radiative forcings is that the relative amplitude of each is determined by physics independent of the temperature record and therefore known. There is ONE unknown parameter - climate sensitivity. This can be estimated stochastically by comparing sum of forcings with temp record.
Now there may be other forcings which matter, and reduce accuracy of the above estimation. Specifically, X, Y above. If either of these is mostly linear it could easily be confused with CO2 forcing.
Y we have already considered. The best estimate of it is the Climax GCR count, with sunspot cycle periodicity and no linear component.
X is more complex. There are two distinct effects have been identified (X1: ENSO Nino vs Nina and X2: PDO). each of these effects is not a real number. It is constructed from measurements of anomalies in local sea temperatures suitable averaged and obviously is not a unique index. you can put the raw figures together choosing different ones in different ways to obtain many different possible single parameters.
This is a recipe for fraud. Easy for somone with an agenda to concoct a compound parameter representing one or both of these two effects which has the overall characteristics they want. There are maybe 20 physical parameters each correlated with the ocean phenomena, and no obvious way to decide which to choose or how to weight them. In this case an overall linear trend would raise possibility that this not the above forcings was causing the global temp graph.
Well, here is the "standard" PDO parameter. Of course it may have been concocted. But it shows no linear dependence with time and does not seem needed to explain global temperature trends once all the other forcings are decorrelated (remember only ONE free parameter necessary for this decorrelation).
Smoothed:
Don't forget the false attribution of water vapor as a positive feedback greenhouse gas, when it isn't. The AGW argument hinges on the need for water vapor to amplify direct CO2 warming by a factor of four in order to get that exponentially upward turning green line.
If the climate were that sensitive, then previous eras in geological history would have sent the planet into Venus-like conditions, which never happened.
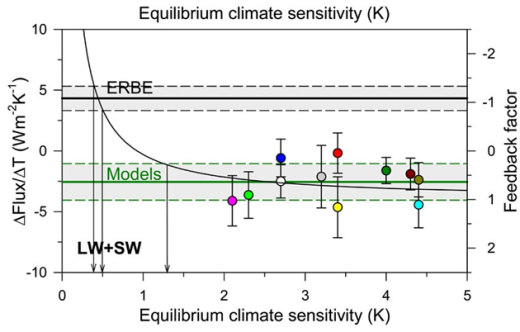
Here's a more robust analysis, comparing actual data to the flaws in all the models, illustrating the real climate sensitivity will always be about 0.5C, not the huge amounts of warming the hockey team's models claim:
http://wattsupwiththat.files.wordpress. ... dzen-3.ppt
I think we may not get much further now.
Just to answer specific issues:
I think the green line is not exponential. Exponentially increasing GHG emmissions (which we more or less have) corresponds to linear increasing forcing.
Re Trust - what I meant to indicate is that in the absense other evidence I would go with the consensus (and Hansen/GISS) not that I would unquestioningly accept their word for things. But perhaps that is also what Simon means!
I should point out that to my knowledge I am the only person on this thread who is seriously questioning the evidence, rather than trotting outr potted arguments. (Well I've done that too - but admit it).
Global temperature anomaly. If you don't accept this I agree there is no common ground. We just have to wait a few years for NH warming to be at or above trend I suppose. Indeed the most popular anti-AGM arguments rely on temperatures now NOT increasing - though doubtless if they do the arguments will change. We could go through an analysis of all the surface station data to try to etimate for ourselves how robust this is. We could look at papers estimating error bars and seeing if we agre with them. etc. For example:- let us read and critique papers (not blogs) discussing heat island effects, satellite data, etc. Accept non-peer-reviewed papers as long as they make justifiable rguments with references to the things they assume. Just like we did with the altimeter data that Simon initially did not accept. (And Simon if you want me to continue to answer your questions that is fine).
In reality you should not be over influenced by two or even three years away from trend. Look at the temperature record. (Oh - sorry - you do not accept that!)
I have listened to all the rabid anti-AGW arguments. On your favourite anti AGW websites the level of the comments is appallingly bad. No logic or consistency. But there are some arguments which need serious consideration. I particularly think that while GCMs are probably now robust after so many years of refinement it is really diffciult to prove that since the level of work to understand all the issues for just one GCM is high, and anyway, GCMs must depends on so much uncertainty it is very problematic drawing conclusions from them.
Of course we have the temperature record (also recently validated by the satellite sea-level record if you assume thermal expansion is main source of se-level chnage). And some observational records of other interesting parameters: sloar irradiance, GHG levels, solar irradiance. So a lot can be done without GCMs.
So perhaps checking up on the global temperature record is the best we can do.
I accept that from 1980 until 1998 there was some warming. I deny that the warming was at variance to natural climate cycles of both short, medium, and long duration.. I accept that from 1920 to 1940, there was warming, and that from there until 1978 there was cooling. I accept that over the past century there has been some warming, as we exited the end of the Little Ice Age, and were approaching the higher temperatures of the Medieval Climate Optimum.tomclarke wrote:I think we may not get much further now.
Just to answer specific issues:
I think the green line is not exponential. Exponentially increasing GHG emmissions (which we more or less have) corresponds to linear increasing forcing.
Re Trust - what I meant to indicate is that in the absense other evidence I would go with the consensus (and Hansen/GISS) not that I would unquestioningly accept their word for things. But perhaps that is also what Simon means!
I should point out that to my knowledge I am the only person on this thread who is seriously questioning the evidence, rather than trotting outr potted arguments. (Well I've done that too - but admit it).
Global temperature anomaly. If you don't accept this I agree there is no common ground. We just have to wait a few years for NH warming to be at or above trend I suppose. Indeed the most popular anti-AGM arguments rely on temperatures now NOT increasing - though doubtless if they do the arguments will change. We could go through an analysis of all the surface station data to try to etimate for ourselves how robust this is. We could look at papers estimating error bars and seeing if we agre with them. etc. For example:- let us read and critique papers (not blogs) discussing heat island effects, satellite data, etc. Accept non-peer-reviewed papers as long as they make justifiable rguments with references to the things they assume. Just like we did with the altimeter data that Simon initially did not accept. (And Simon if you want me to continue to answer your questions that is fine).
In reality you should not be over influenced by two or even three years away from trend. Look at the temperature record. (Oh - sorry - you do not accept that!)
I also accept that astronomers also saw warming on Venus, Mars, Jupiter, Saturn, Neptune, Uranus, and Pluto, absolutely none of which have any anthropogenic influence.
Since 1998 there has been cooling here on earth. With the continued grand minimum and PDO and NAO in cooling trends, we will continue to see cooling for a long while. Whether this minimum is to be of Dalton or Maunder level remains to be seen. We do know that NASAs best estimates of 2006 (based, btw, on solar climate models, lol) are now spectacularly wrong and in the dustbin of history. How long they keep hanging on to similarly wrong (spectacularly so) global climate models before dropping them also remains to be seen. NASA did keep moving the line on their solar predictions as to when the next cycle would start for over a year and a half.
Odd, my own reading of the comments at both CA and RC shows me that the level of comments on RC is the one thats appallingly bad, mostly nonscientist fanbois, but even the supposed scientists can't avoid smear and ad hominem on a regular basis, and feign offense and claim rudeness whenever they are requested to disclose data and methods. Conversely, CA folks are generally focused on the content of the articles, most commenters are in fact statistically skilled to a greater extent than any hockey team member.
I have listened to all the rabid anti-AGW arguments. On your favourite anti AGW websites the level of the comments is appallingly bad. No logic or consistency. But there are some arguments which need serious consideration.
http://www.climateaudit.org/?p=6160
At RC, besides the typical "deniers are idiots" ad hom that is frequent on an hourly basis, you also get the "deniers are corporate shills for (insert name of hated mining/drilling/manufacturing company/industry association)" ad hom without a shred of proof, but an implicit assumption that because someone is talented enough to make money from their skills that they are inherently biased (which is ironic given the sorts of entities that AGW alarmists make their money off of).
BTW: Steve McIntyre is retired and thus is a shill for nobody.
Look at lindzen's powerpoint presentation to the end and you'll see how "robust" the models are at replicating the temperature record. Just because all your models agree with each other doesnt make them robust. If they all disagree with reality, then they are all not worth toilet paper.
I particularly think that while GCMs are probably now robust after so many years of refinement it is really diffciult to prove that since the level of work to understand all the issues for just one GCM is high, and anyway, GCMs must depends on so much uncertainty it is very problematic drawing conclusions from them.
Of course we have the temperature record (also recently validated by the satellite sea-level record if you assume thermal expansion is main source of se-level chnage). And some observational records of other interesting parameters: sloar irradiance, GHG levels, solar irradiance. So a lot can be done without GCMs.
So perhaps checking up on the global temperature record is the best we can do.