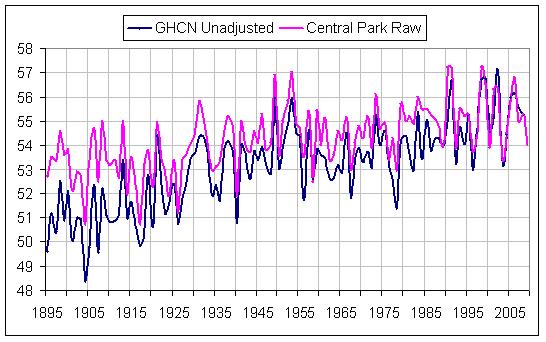
This was quite interesting. I wondered, "How come GHCN raw doesn't coincide with the raw NOAA temperature record?" (As is being claimed.)
Well, I spent the last twenty minutes going over the data sets, and it seems quite clear, now.
First, he links this data set as his "raw" data for Central Park (note that this is in Fahrenheit): http://www.erh.noaa.gov/okx/climate/rec ... ltemp.html
Then, he links the GISS data site for "raw" data: http://data.giss.nasa.gov/gistemp/station_data/
The relevant station ID number is 725030010 (plop it in to the search field).
Your options for the data set are:
1) raw GHCN data + USHCN corrections
2) after combining sources at same location
3) after homogenity adjustment
He wants you to click 1, here.
If you do this, load the relevant text file, and compare it to the original link (the first link I have given), and you compare the temperatures, they, indeed, are way way off the chart.
So, being scientifically inclined, I tried options 2 and options 3. It turns out the original "raw data" is in fact using homogenized data!
Want proof? You can view these graphs by going to the page and following the steps I explained to you.
raw GHCN data + USHCN corrections

after homogenity adjustment

Now, to further illustrate the point, I will take the year 2008 from the GISS homogenized temperatures, and I will take the year from the original "raw" link he provides, and show you how their temperatures are identical (within the margin of error because the "original" link is converted from C to F and I will have to convert it back again). I am using 2008 because 2009 is incomplete in the GISS text file.
Note the last number is the annual average.
Code: Select all
ORIGINAL (in F)
2008  36.5 35.8 42.6 54.9 60.1 74.0 78.4 73.8 68.8 55.1 45.8 38.1  55.3
ORIGINAL (in C with extra decimal)
2008  2.5 2.11 5.88 12.72 15.61 23.33 25.77 23.22 20.44 12.83 7.66 3.38  12.94

GISS / GHCN (in C)
2008 2.5 2.1 6.0 12.8 15.6 23.4 25.8 23.2 20.4 12.9 7.7 3.4   2.5 11.5 24.1 13.7  12.93
GISS / GHCN (in C with seasonal avgs removed)
2008 2.5 2.1 6.0 12.8 15.6 23.4 25.8 23.2 20.4 12.9 7.7 3.4 12.93

ORIGINAL OVER GHCN (with decimal removed)
ORIG 2008 2.5 2.1 5.8 12.7 15.6 23.3 25.7 23.2 20.4 12.8 7.6 3.3  12.94
GHCN 2008 2.5 2.1 6.0 12.8 15.6 23.4 25.8 23.2 20.4 12.9 7.7 3.4 12.93Being scientifically minded I intuited something was wrong within seconds of seeing the data. But because I am scientifically minded I did not immediately write it off as true or false, I had to see where the comparison failed or succeeded. Usually I don't go to these lengths to explain why I see something and how I see it (I had to type in each temperature into google to convert them), I simply do a random test (picking several numbers out of the homogonized data and several out of the "raw" original data, plus, I can intuit C to F fairly easily and it was obvious that the "raw" data set was in fact GHCN/GISS homogenized), and come to my conclusion. However, I wanted to make it clear here, MSimon, not all of the arguments you read are credible. They are nonsense disguised as critical thinking. I wish you had just a bit of scientific urge in you to understand how things work rather than taking for granted what people say.
I'm afraid you would not have believed me if I simply replied, "MSimon, he is graphing raw but corrected data with homogenized data, and claiming the homogenized data is raw."
I could go in to the other reasons why the rest of this stuff is wrong, but *explaining* things is very difficult if you don't have a scientific inclination to actually do the research yourself.

